
To make application 100% available with zero downtime
-
Application should restart itself and there should be multiple instances for application on 2–3 different EC2 containers ( depends on Prod Infra )
-
Runtime DB update should happen without bringing down application it should be done at runtime and new seed data should be available in system.
-
System should have capability to add new seed data and add or remove feature toggle to enable and disable feature in application.
-
Deployment should happen one instance at a time so other instance keep serving request coming from clients.
Application deployment will happen using PM2 and will be apart of CI/CD process of application.
-
Application deployment will happen using pm2 reload functionality to keep application up and running, PM2 reload will be Deploying one instance at a time to keep application up and running without downtime. In production we will be running at least 2 instance on a single system and will be having 3 EC2 medium instance. PM2 reload will read configuration from ecosystem.config.js.
-
Deployment can happen manually on server by doing SSH to that server.
-
PM2 deployment need to be added as server start script so if system gets restarted then application comes up with it.
-
Application will be up once db connection has been done in node application.
deployment options :
cd /usr/<your-build-path
npm run deploy
pm2 list

module.exports = {
 apps: [
   {
     name: 'api_server',
     script: 'app/server.js',
     instances: 2,
     wait_ready: true,
     listen_timeout: 50000,
     kill_timeout: 15000
   }
 ]
};
Runtime error in application
To keep application up and running we need to have API up and running without any issues or exception like unhandled promise rejection or exception or connection issues
Issues can come at runtime
-
runtime exception from some api will break server and will restart instance but will make instance unhealthy.
-
runtime issues can be related to memory, if memory is not available due to logs filling memory
-
runtime issue can occur due to some package start breaking
-
issue can be there due to connection or network issue on container like container unable to access DB or redis.
Preventing these runtime errors :
-
Log monitoring will help us to identify any exception or error in system and all gets logged in key metrics or monitoring tools
-
We are having log rotate and cron should be added to clear the logs for PM2
-
We have baselined packages and same will be used on production.
ELB health check on API server
We should have load balancer placed before our EC2 containers which will help application to manage more traffic in application and will also keep checking health of application so it application is down it will not forward traffic to that server.
How All this can be Done (pm2, keymetrics, tools)
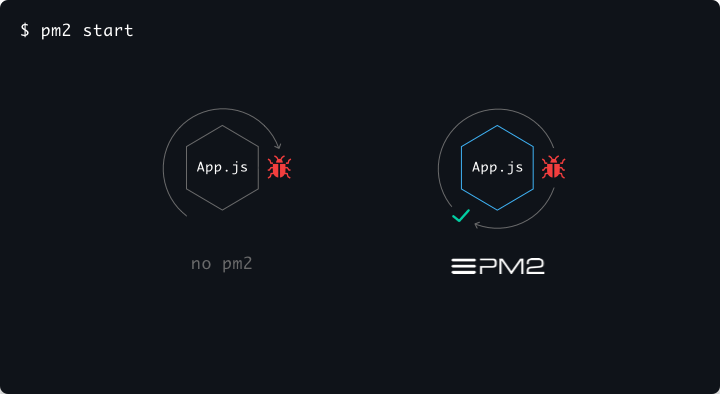
PM2 is a battle tested, production ready runtime and process manager for Node.js applications. It comes with a built-in load balancer, as well, which makes scaling applications even easier. Best of all, it works on Linux, Windows, and macOS.
With a configuration file (process.json), you specify what processes you want to run and how many you’d like to scale to. When starting PM2, you specify the process.json file and PM2 takes care of the rest. (More on process files in a bit 😉)
What all of this means is that PM2 allows you to keep your Node.js applications alive forever, and to reload them with zero downtime when you have updates to your application or server.
Installing PM2
Installing PM2 is a piece of cake. First, you’ll want to make sure that you have your process.json file ready to go in your code so we can kick off the process.
If you’re on macOS, installing is as simple as running yarn add global pm2. If you’re on Linux, Windows, or using a Docker container (yes, it supports Docker as well), follow the instructions here.
If you’re curious what it should look like, here is an example of our process_prod.json file for Winds, our open-source RSS & Podcast application:
{
	"apps": [
		{
			"name": "api",
			"cwd": "api/dist",
			"script": "server.js",
			"watch": false
		},
		{
			"name": "conductor",
			"cwd": "api/dist/workers",
			"script": "conductor.js",
			"watch": false
		},
		{
			"name": "rss-worker",
			"cwd": "api/dist/workers",
			"script": "rss.js",
			"instances": 2,
			"exec_mode": "cluster",
			"watch": false
		},
		{
			"name": "podcast-worker",
			"cwd": "api/dist/workers",
			"script": "podcast.js",
			"instances": 2,
			"exec_mode": "cluster",
			"watch": false
		},
		{
			"name": "og-worker",
			"cwd": "api/dist/workers",
			"script": "og.js",
			"instances": 2,
			"exec_mode": "cluster",
			"watch": false
		}
	]
}
As you can see, we’re running several processes, and PM2 handles them without any issues, automatically using the Node.js Cluster API to spawn multiple processes.
Tips & Tricks
With any application (or process manager in our case), it’s good to know a few tips and tricks from individuals who have previously used it.
Auto Restart
Once it’s started, your app is forever alive, auto-restarting after crashes and machine restarts — all with one simple command:
pm2 startup
Process Management
No matter how many applications you’re running, PM2 has a suite of commands that allow you to manage their respective states. Below are a few of our favorite commands (in no particular order):
-
pm2 start process_prod.json — Start process(es) via process JSON file
-
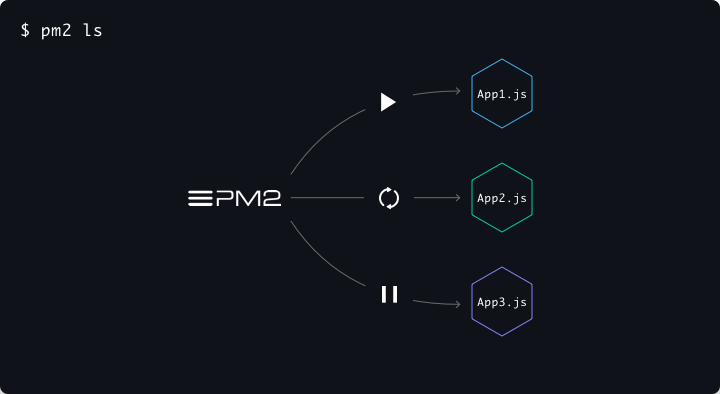
pm2 ls — Show a list of all applications
-
pm2 stop <app — Stops a specific application
-
pm2 start <app — Starts a specific application
-
pm2 <app scale N — Scales the application you specify to N number of instances (can be used to scale up or down)
-
pm2 kill — Kills all running applications
-
pm2 restart — Restarts all running applications
-
pm2 reload — Reloads the app configuration (this comes in handy when you modify your application’s environment variables)
Process Management
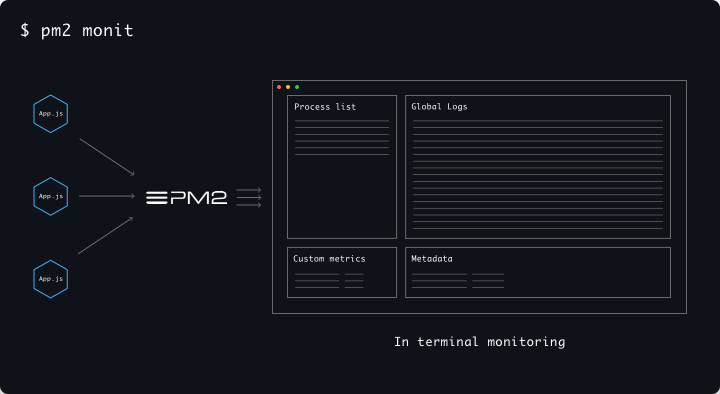
Running the command pm2 monit will return a rich set of data around your application’s health. For example, you’ll see CPU utilization, memory usage, requests/minute, and more!
Log Management
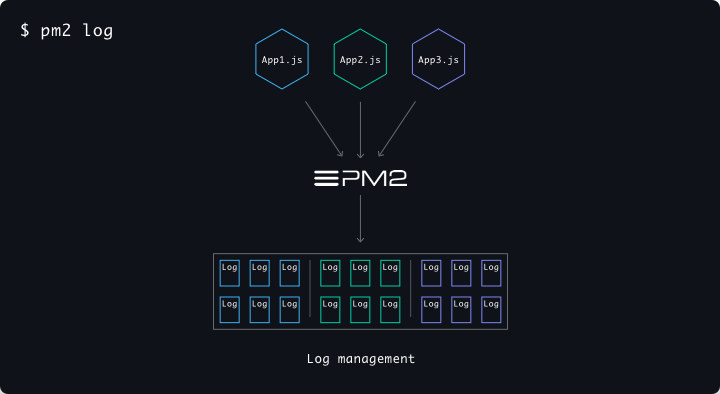
PM2 has built-in log management. It aggregates log data from all of your applications and writes it to a single source for viewing. You can even tail the logs in real-time to see what’s going on behind the scenes with your application. Log Management from PM2 comes with log rotation as well, which is important, especially if you’re application is outputting verbose logs on a frequent basis.
There are three commands that I use often, and you should too:
-
pm2 logs — Outputs logs from all running applications
-
pm2 logs app — Outputs logs from only the app application
-
pm2 flush — Flushes all log data, freeing up disk space
Remember, the most important thing to do is to enable log rotation. Doing so will split one giant log file into many smaller files that are more manageable for PM2. To do this, run the following command:
pm2 install pm2-logrotate
More information on Log Management can be found here.
If you’re finding that your instance is filling up with logs often, think about using a centralized logging service such as Loggly, Papertrail, or ELK.
Use PM2 Monitoring Tool : Keymatrics Tool
Overview
Why monitor your app with PM2 Plus ? At the end of this overview, you’ll have a better understanding of the capabilities of monitoring your app with PM2 Plus.
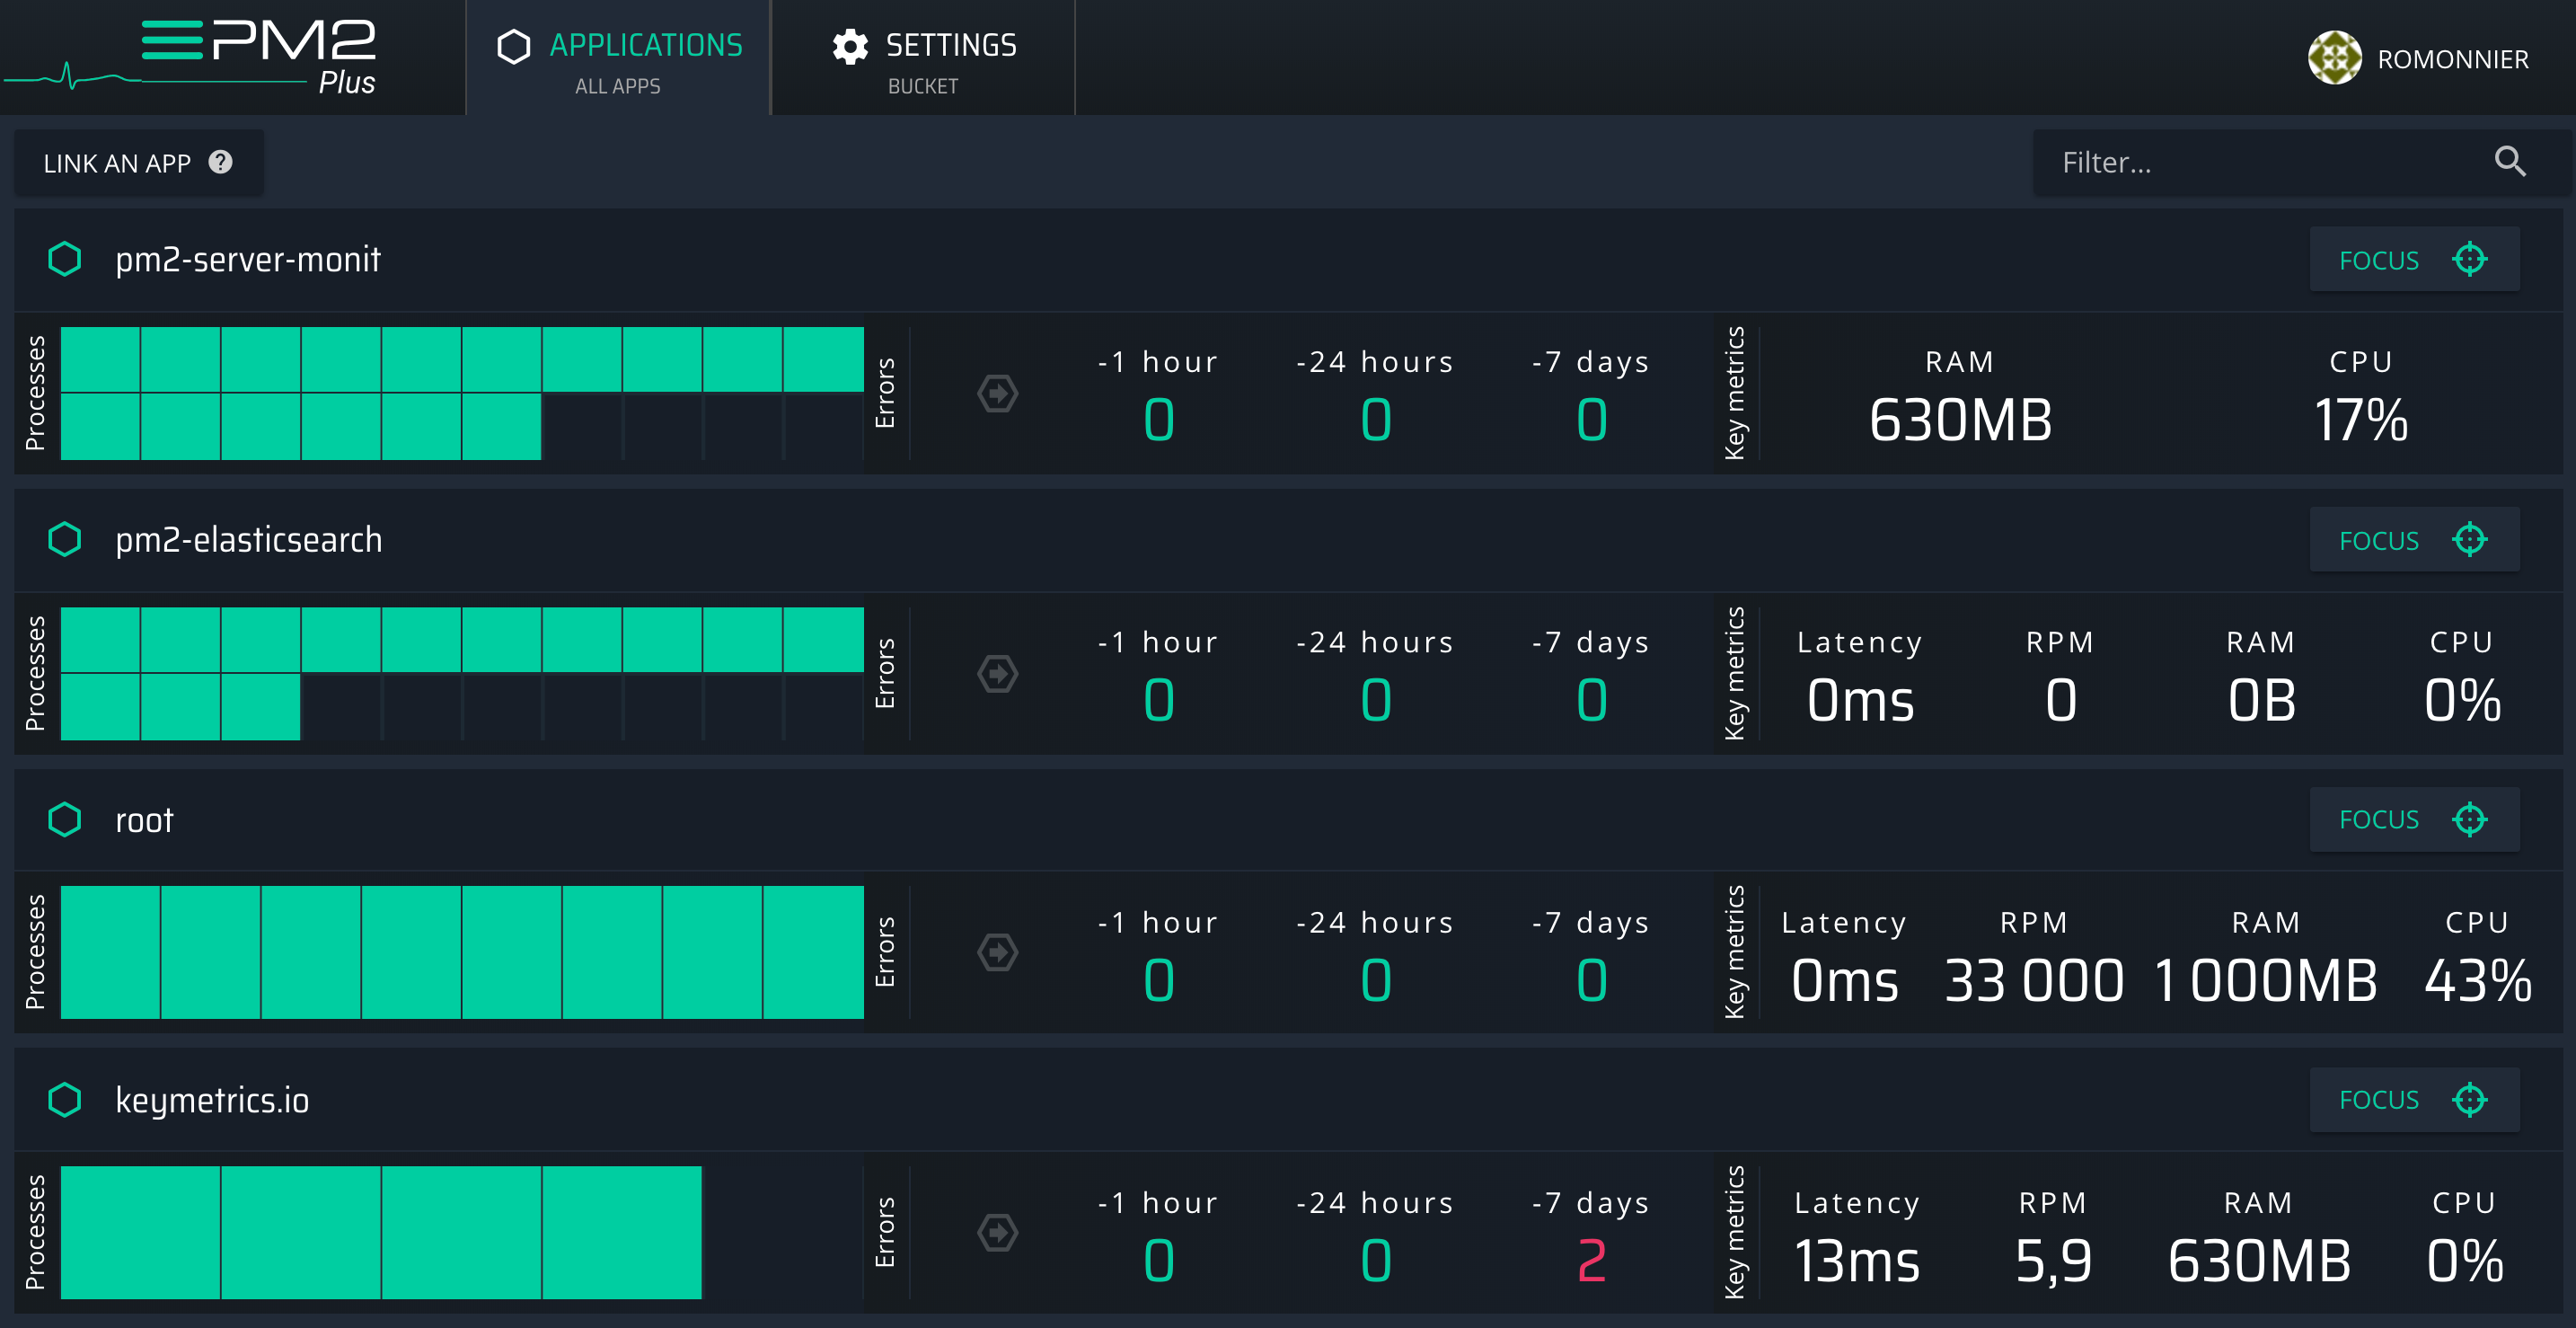
PM2 Plus allows you to have an extended view of all your apps and databases in one single place, at real-time or through history. Stop ssh in all your servers one by one, instead, save time by having a condensed infrastructure plus view.
Expose the important variables from your Node.js applications source code and display them as performance metrics on the PM2 Plus dashboard. Monitor values that matter.
Know when a data reaches a threshold, when an error occurred in your application or when your production application is down.
Even though PM2 makes sure that your application have no downtime, be notified in these critical situation in order to react. Be notified and reactive in any critical situations.
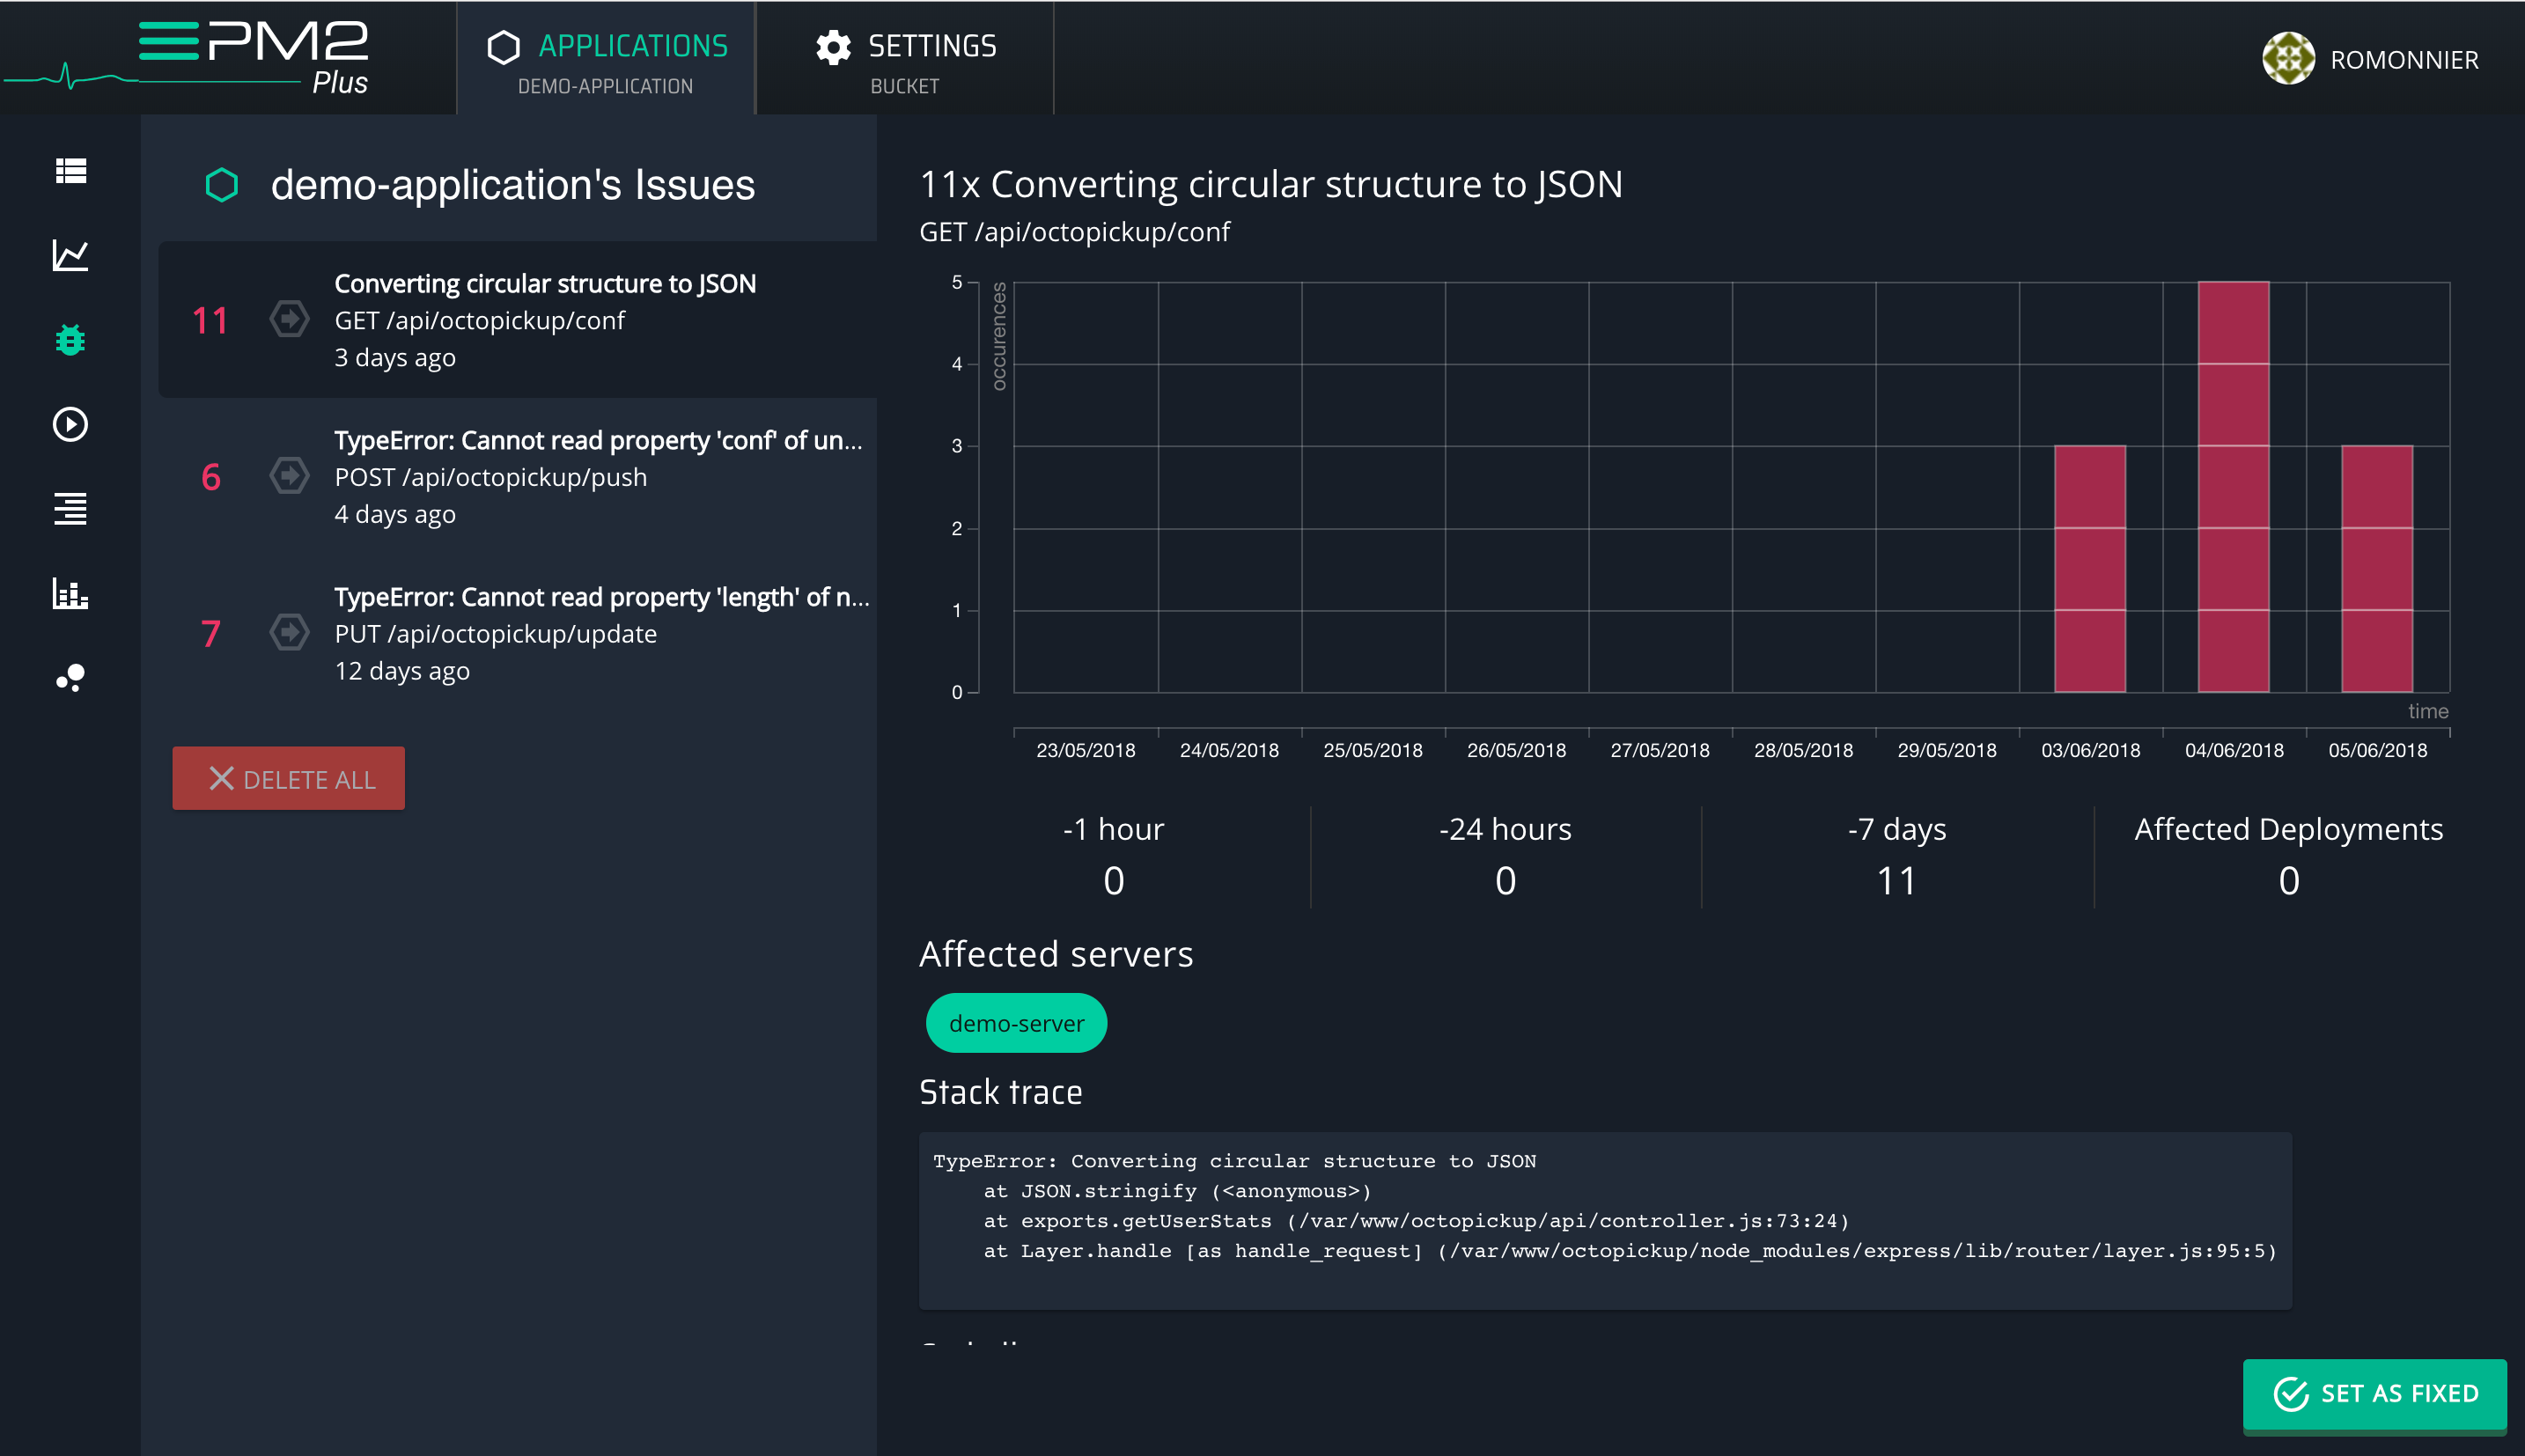
PM2 Plus reports the list of all errors in the “Issue Dashboard” occurred in your Node.js and gets you notified.
Stop spending time finding bugs or trying to replay them, we provide you an “Issue Dashboard” with everything in one place, to make debugging easier. Drill down in your code and get the answer.
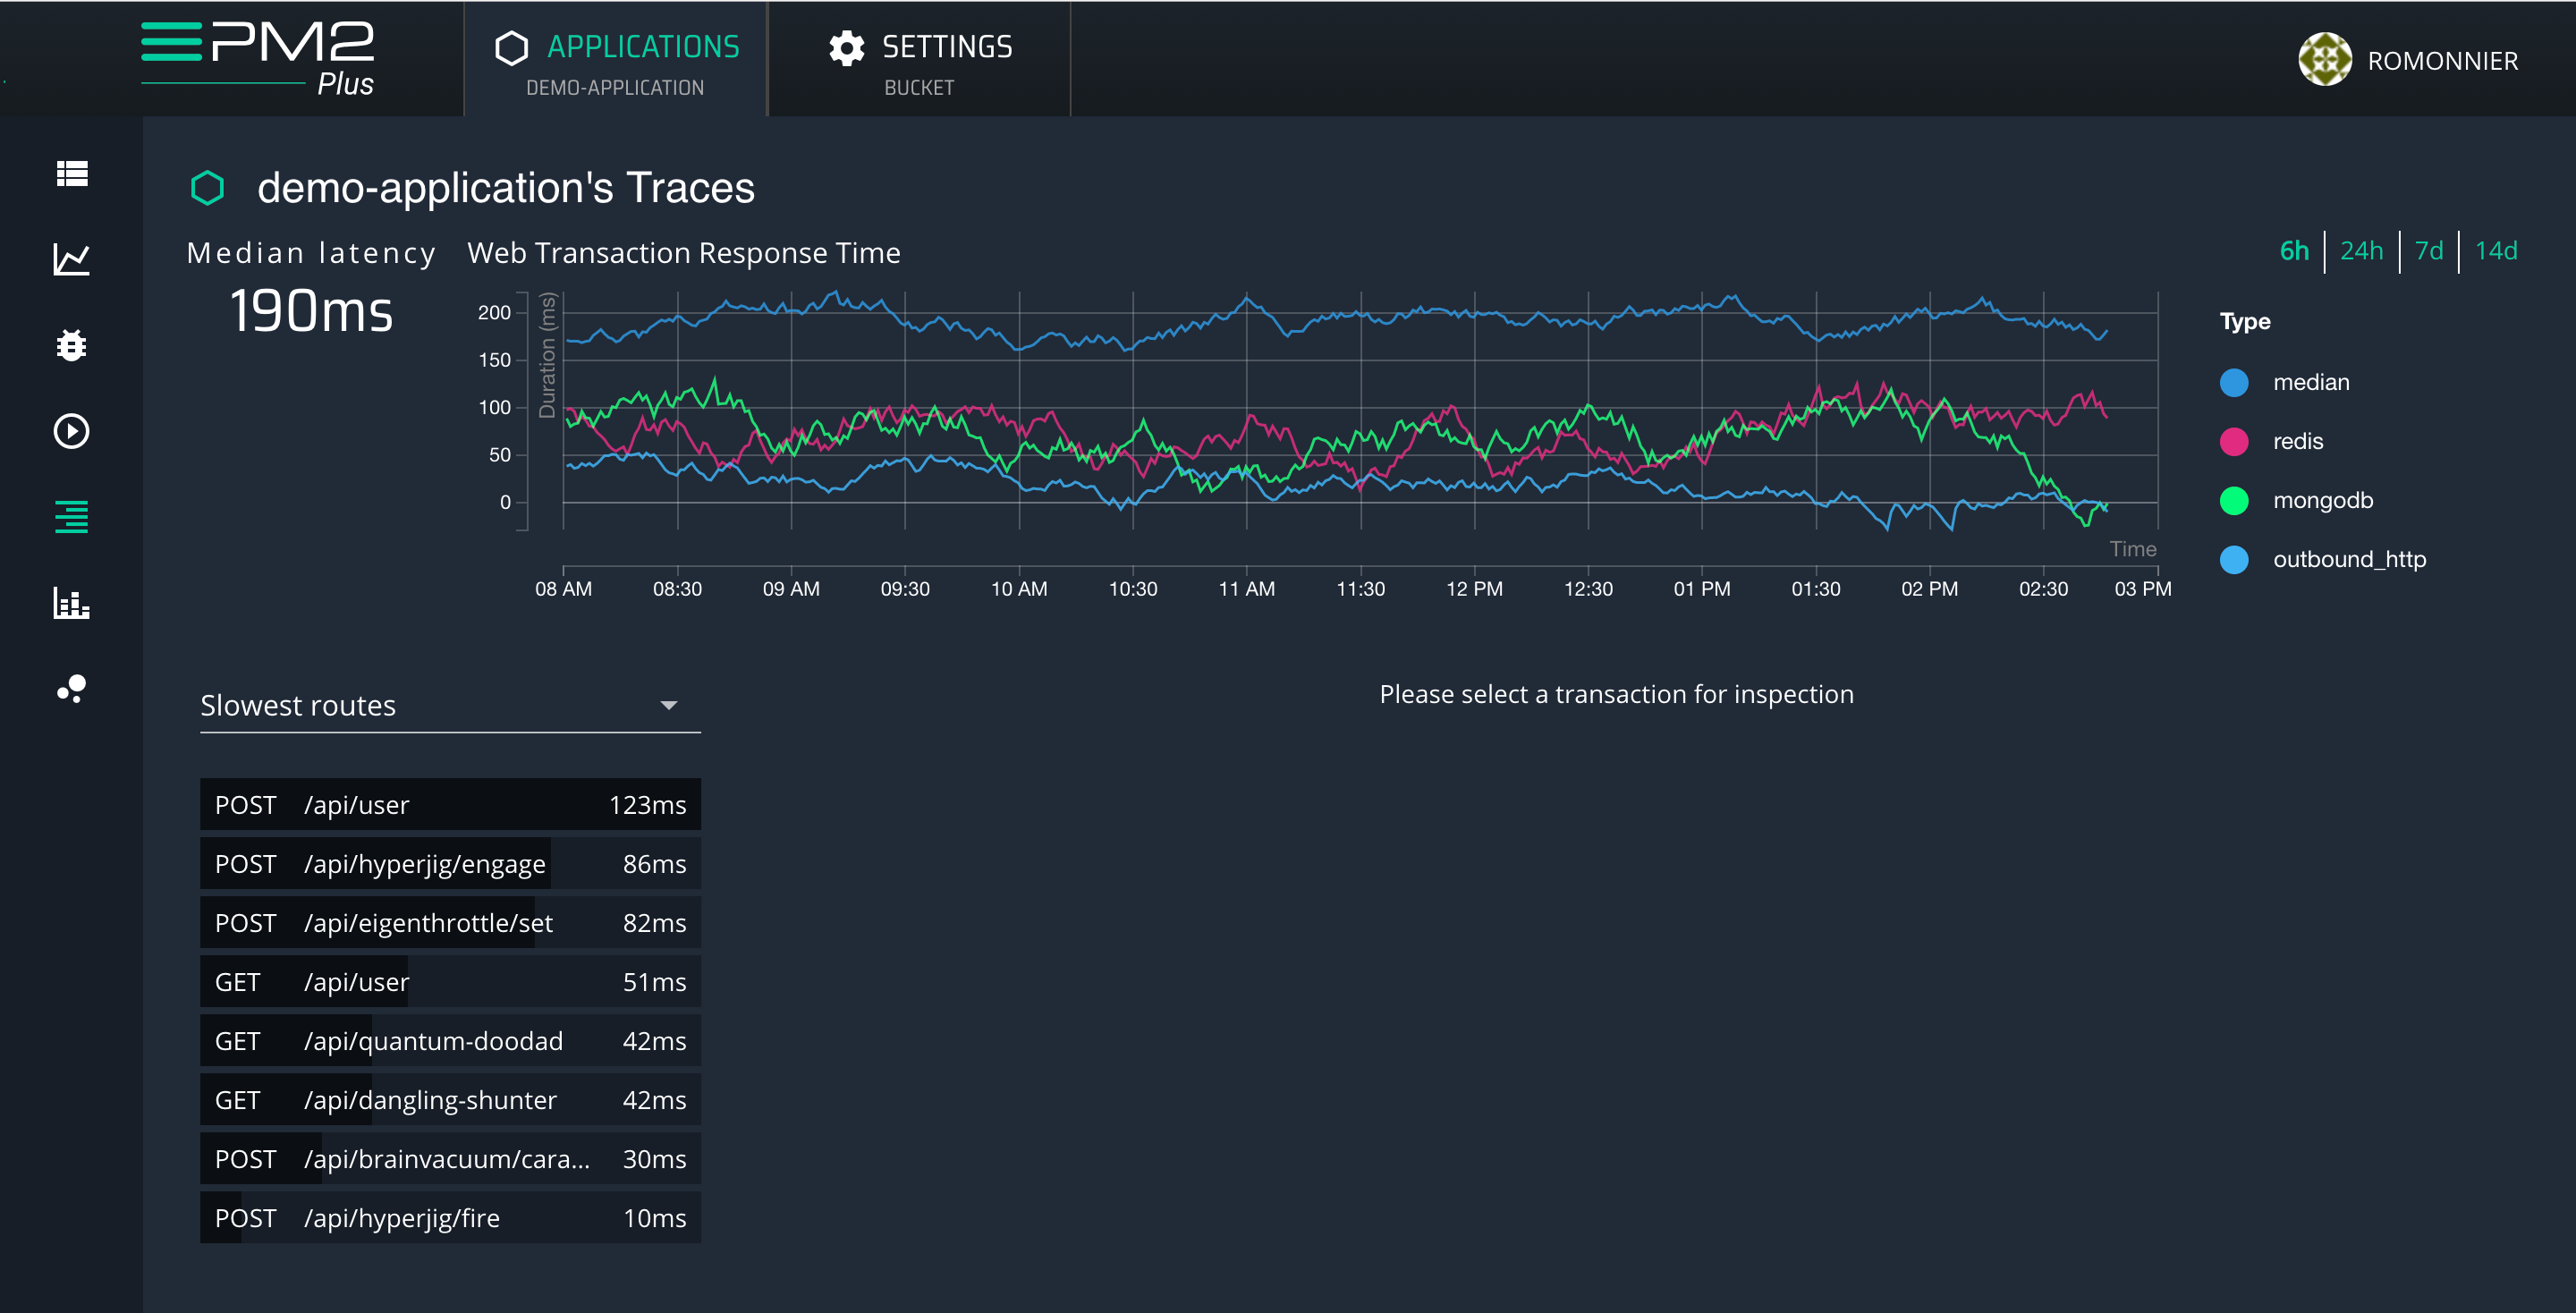
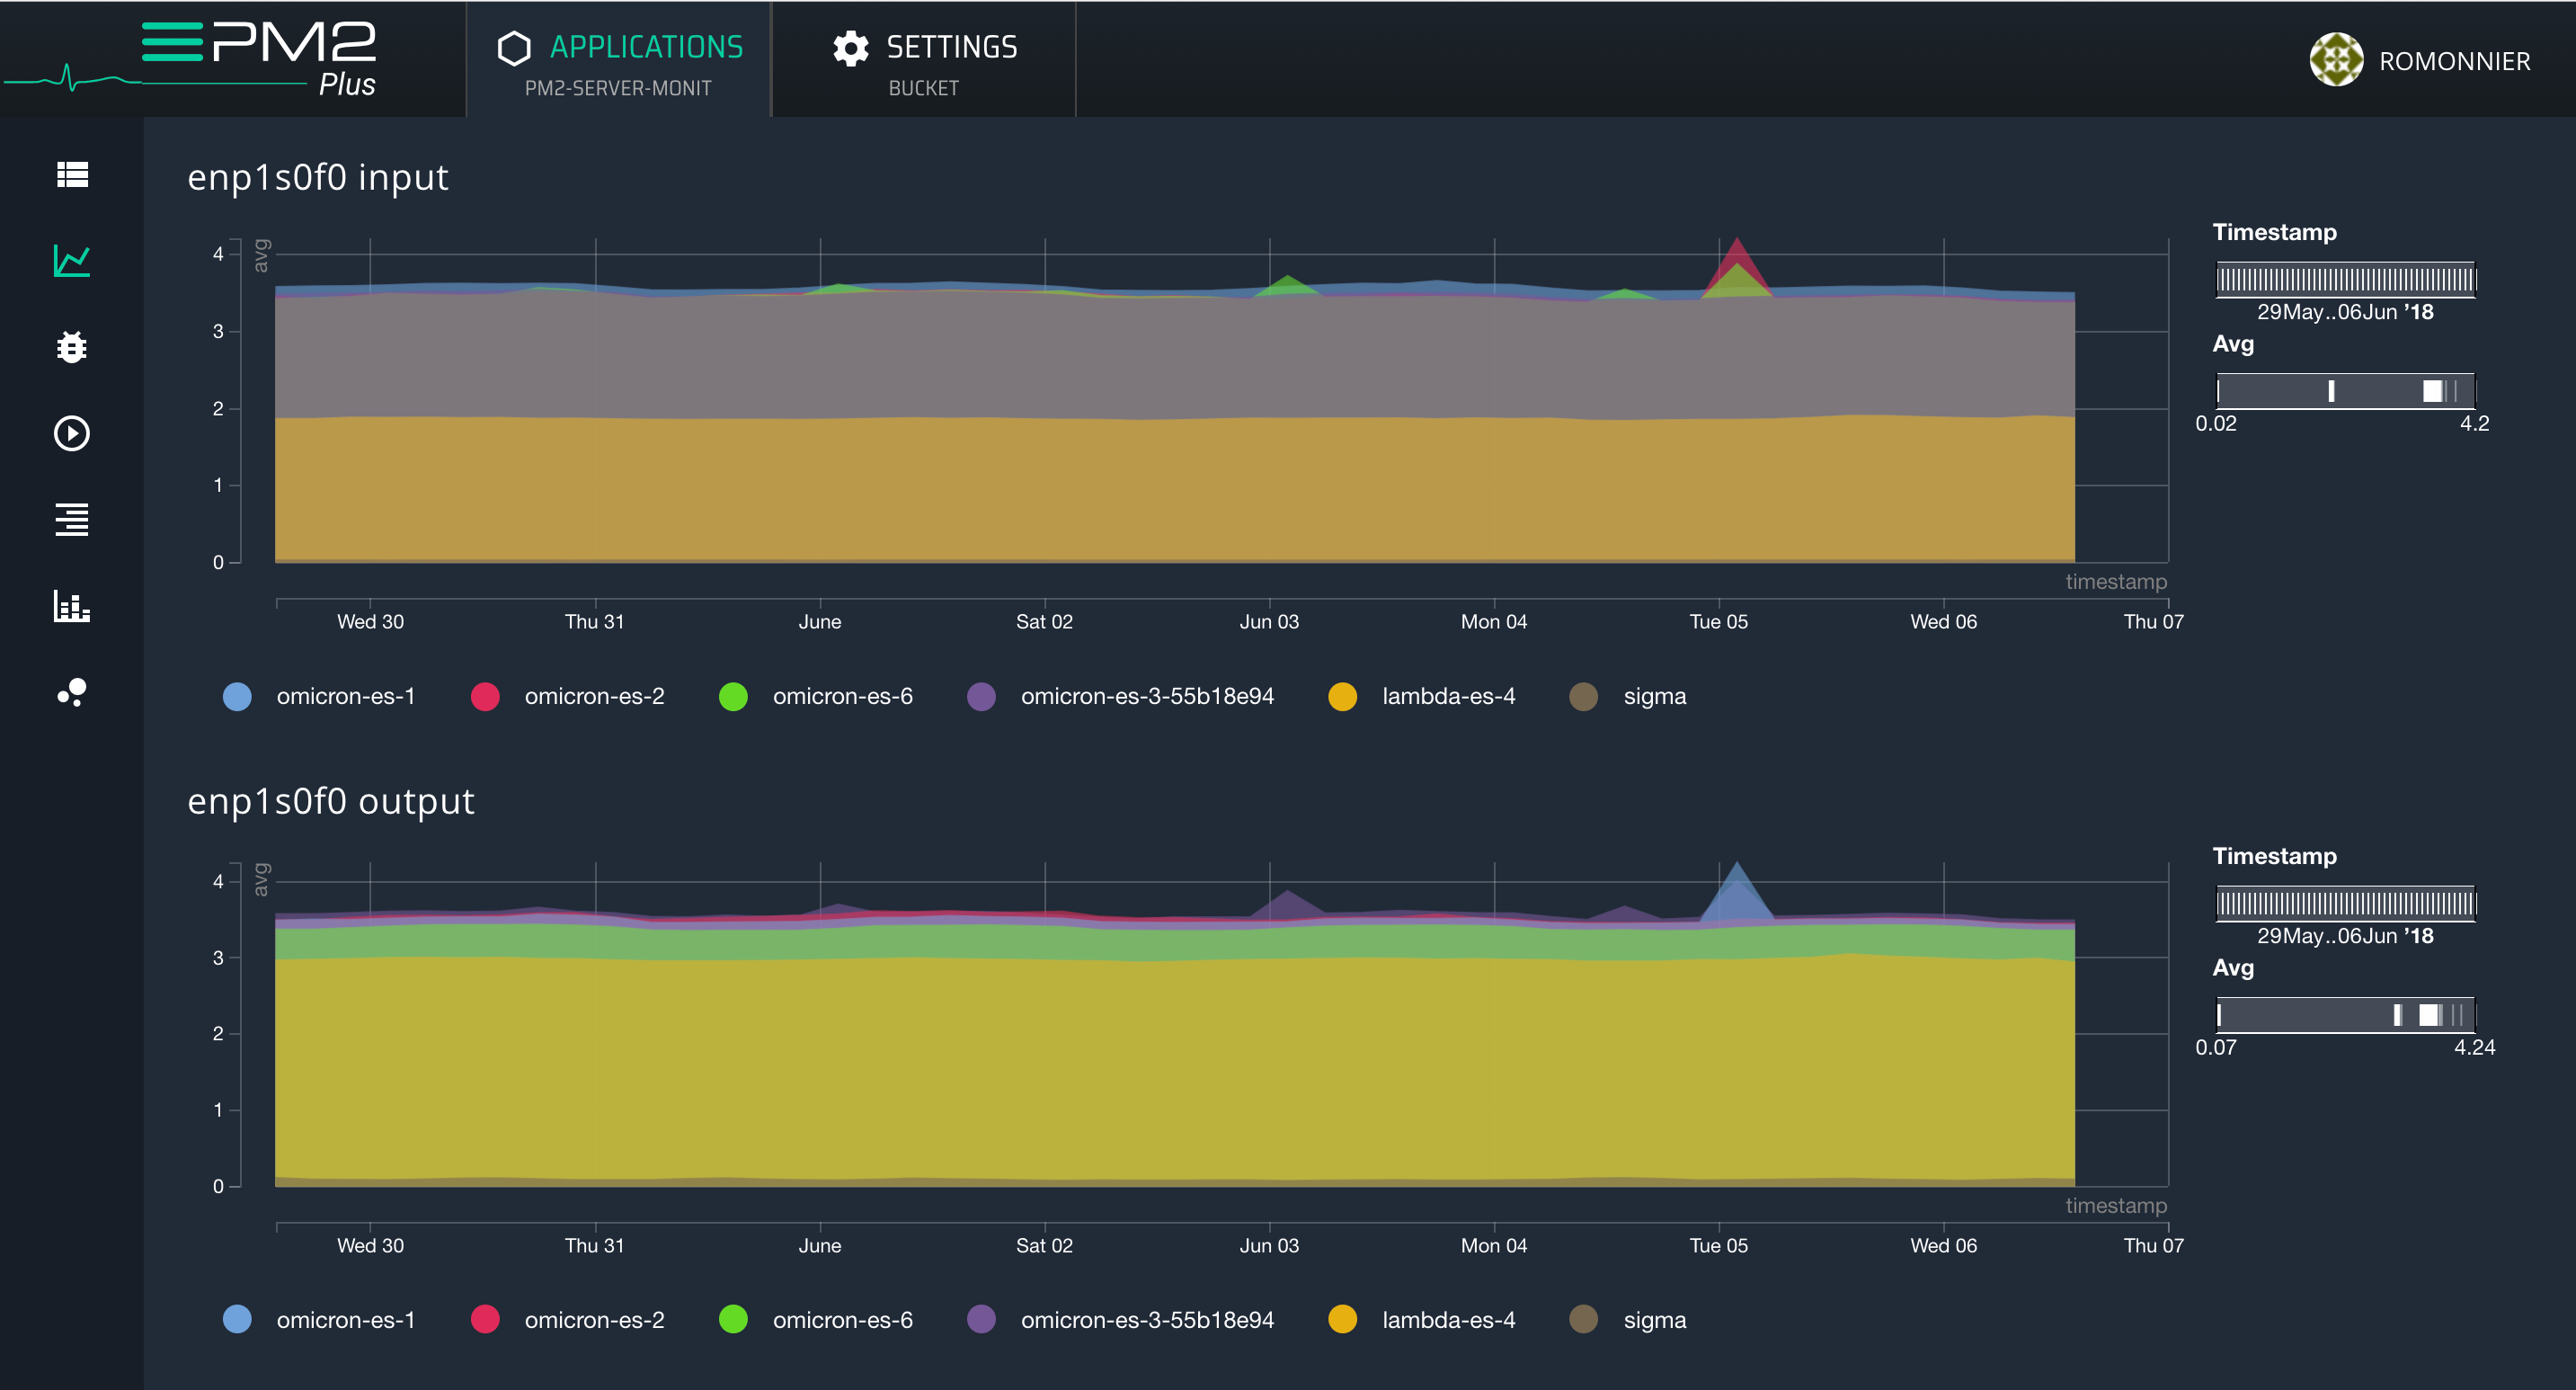
Record and aggregate the database and external calls that your application makes on every http request.
The “Transaction Tracing” helps you troubleshoot performance issues and to get detailed low-level insight into how your app is working (slowest routes, most consuming, number of calls). Provide a better user experience and make your app faster.
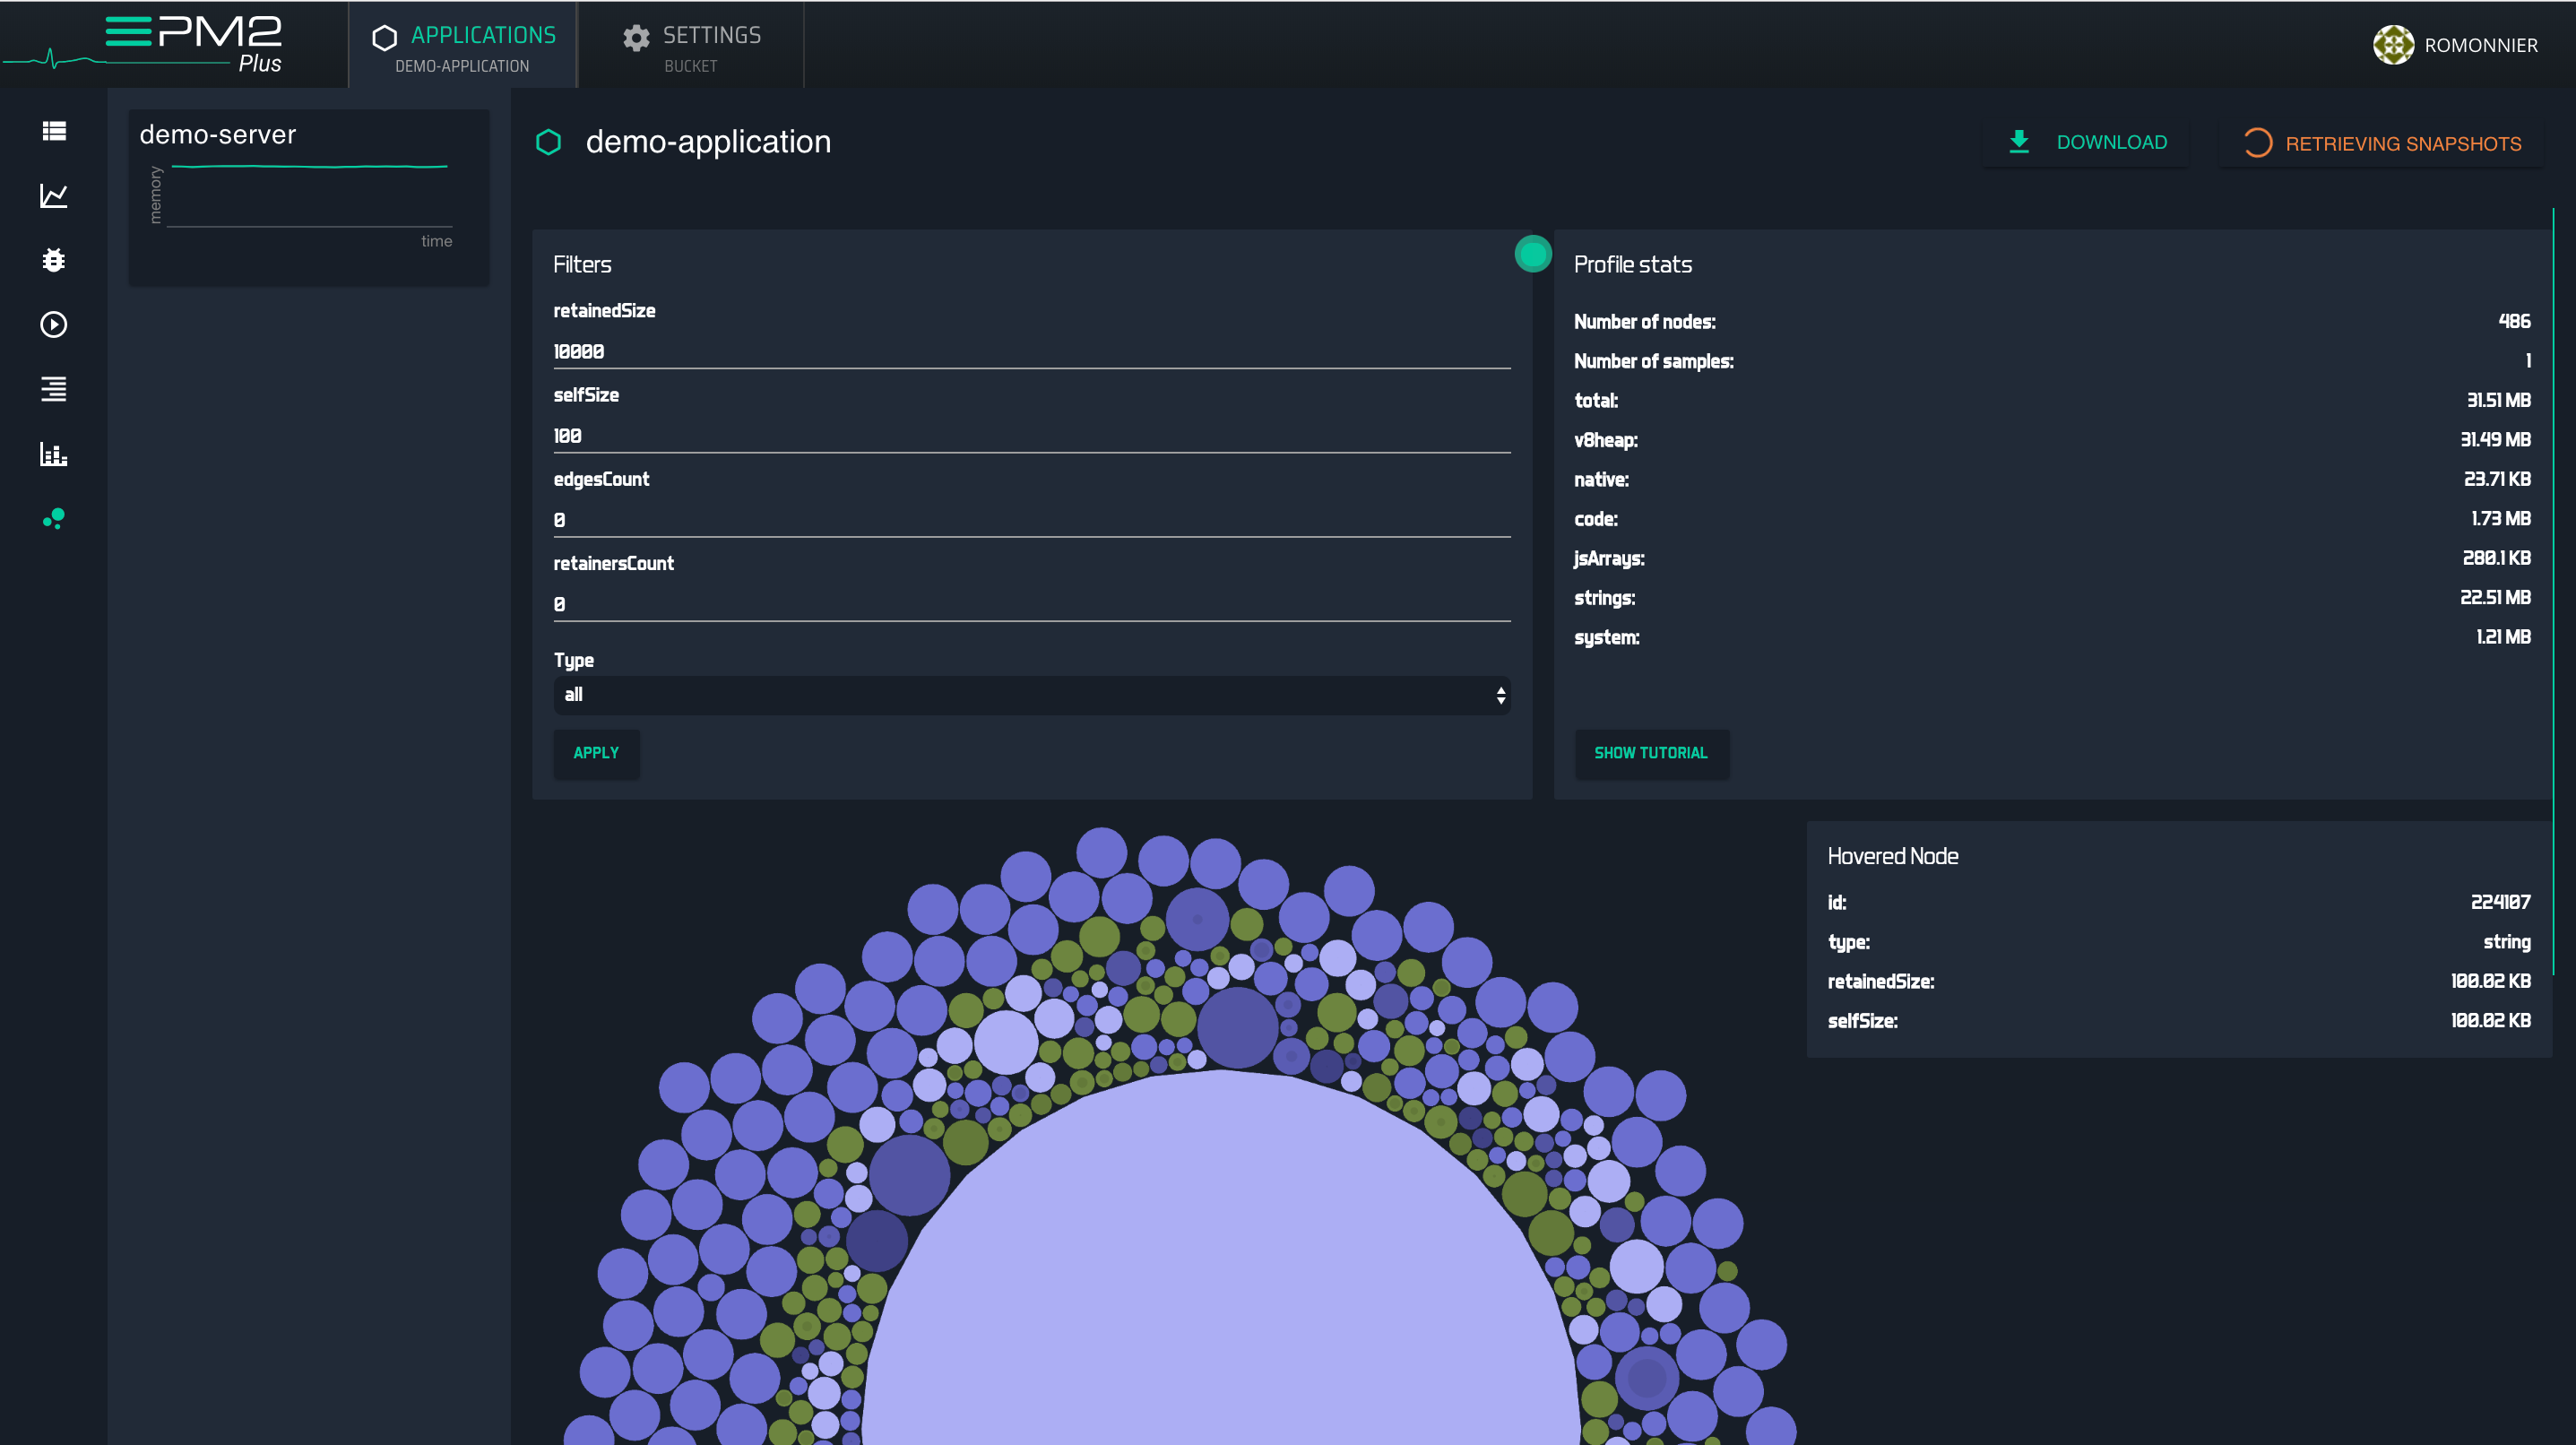
Take memory heapdumps straight from your production servers.
Memory profiling lets you find any memory leaks in your application.
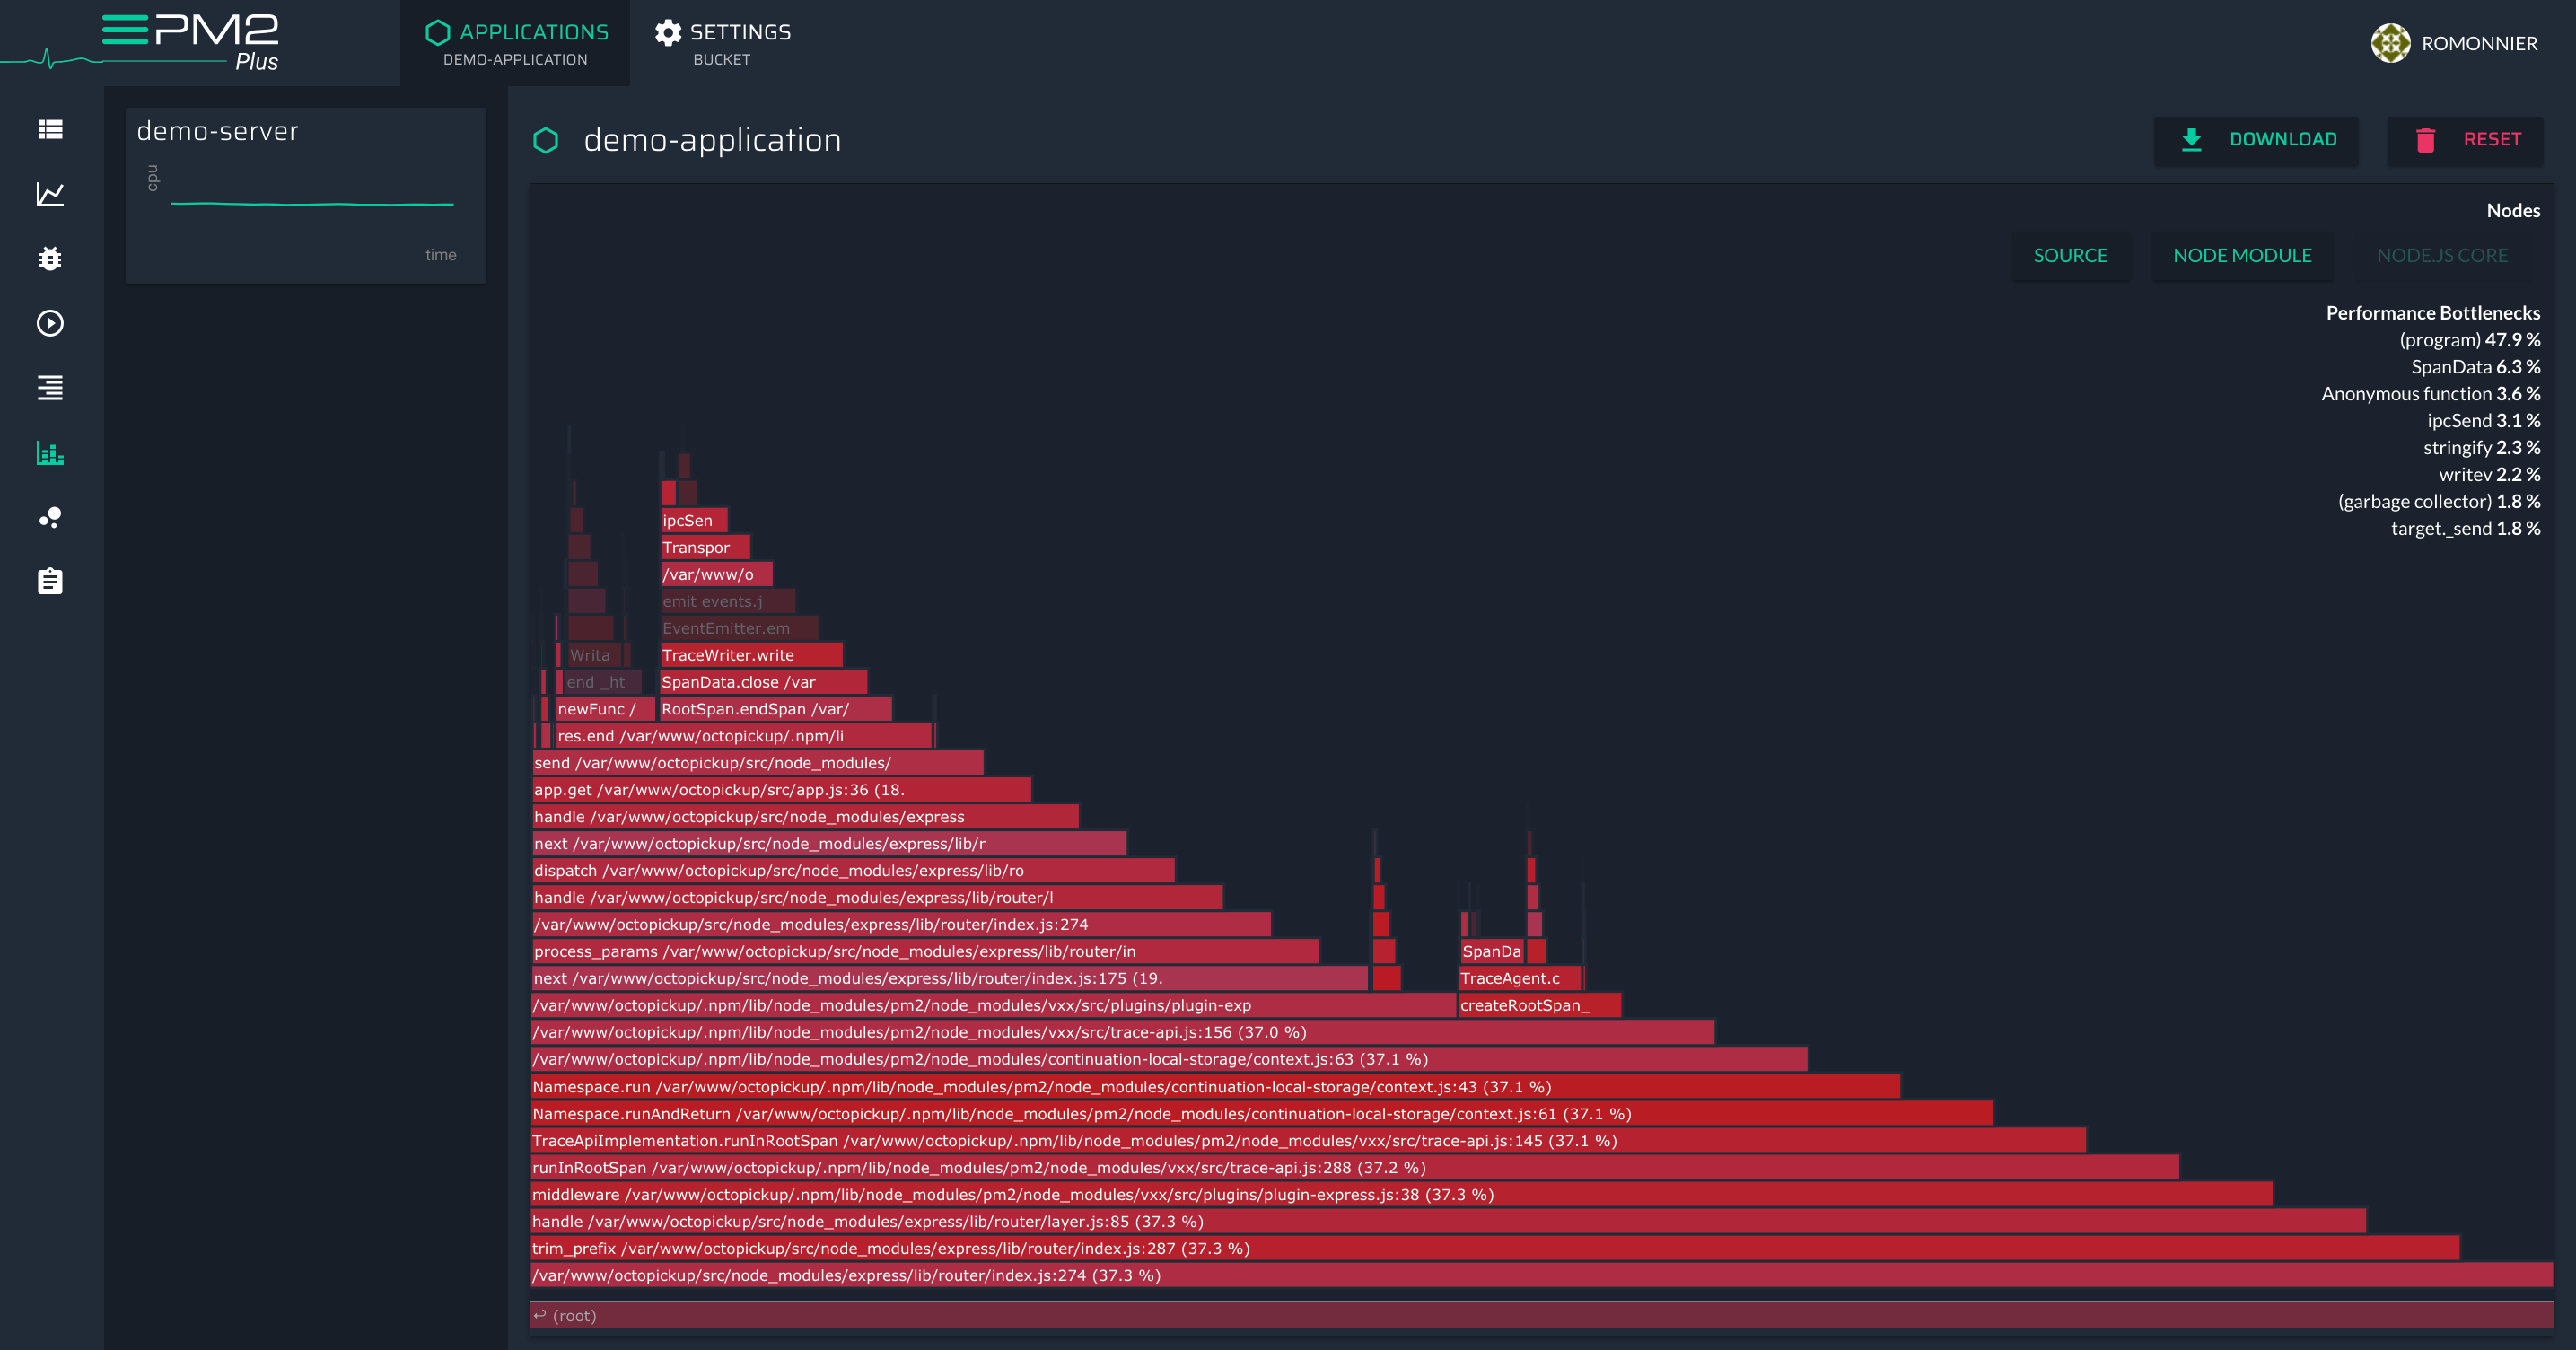
Take CPU snapshots straight from your production servers.
CPU profiling helps you identify particular resource-heavy tasks.
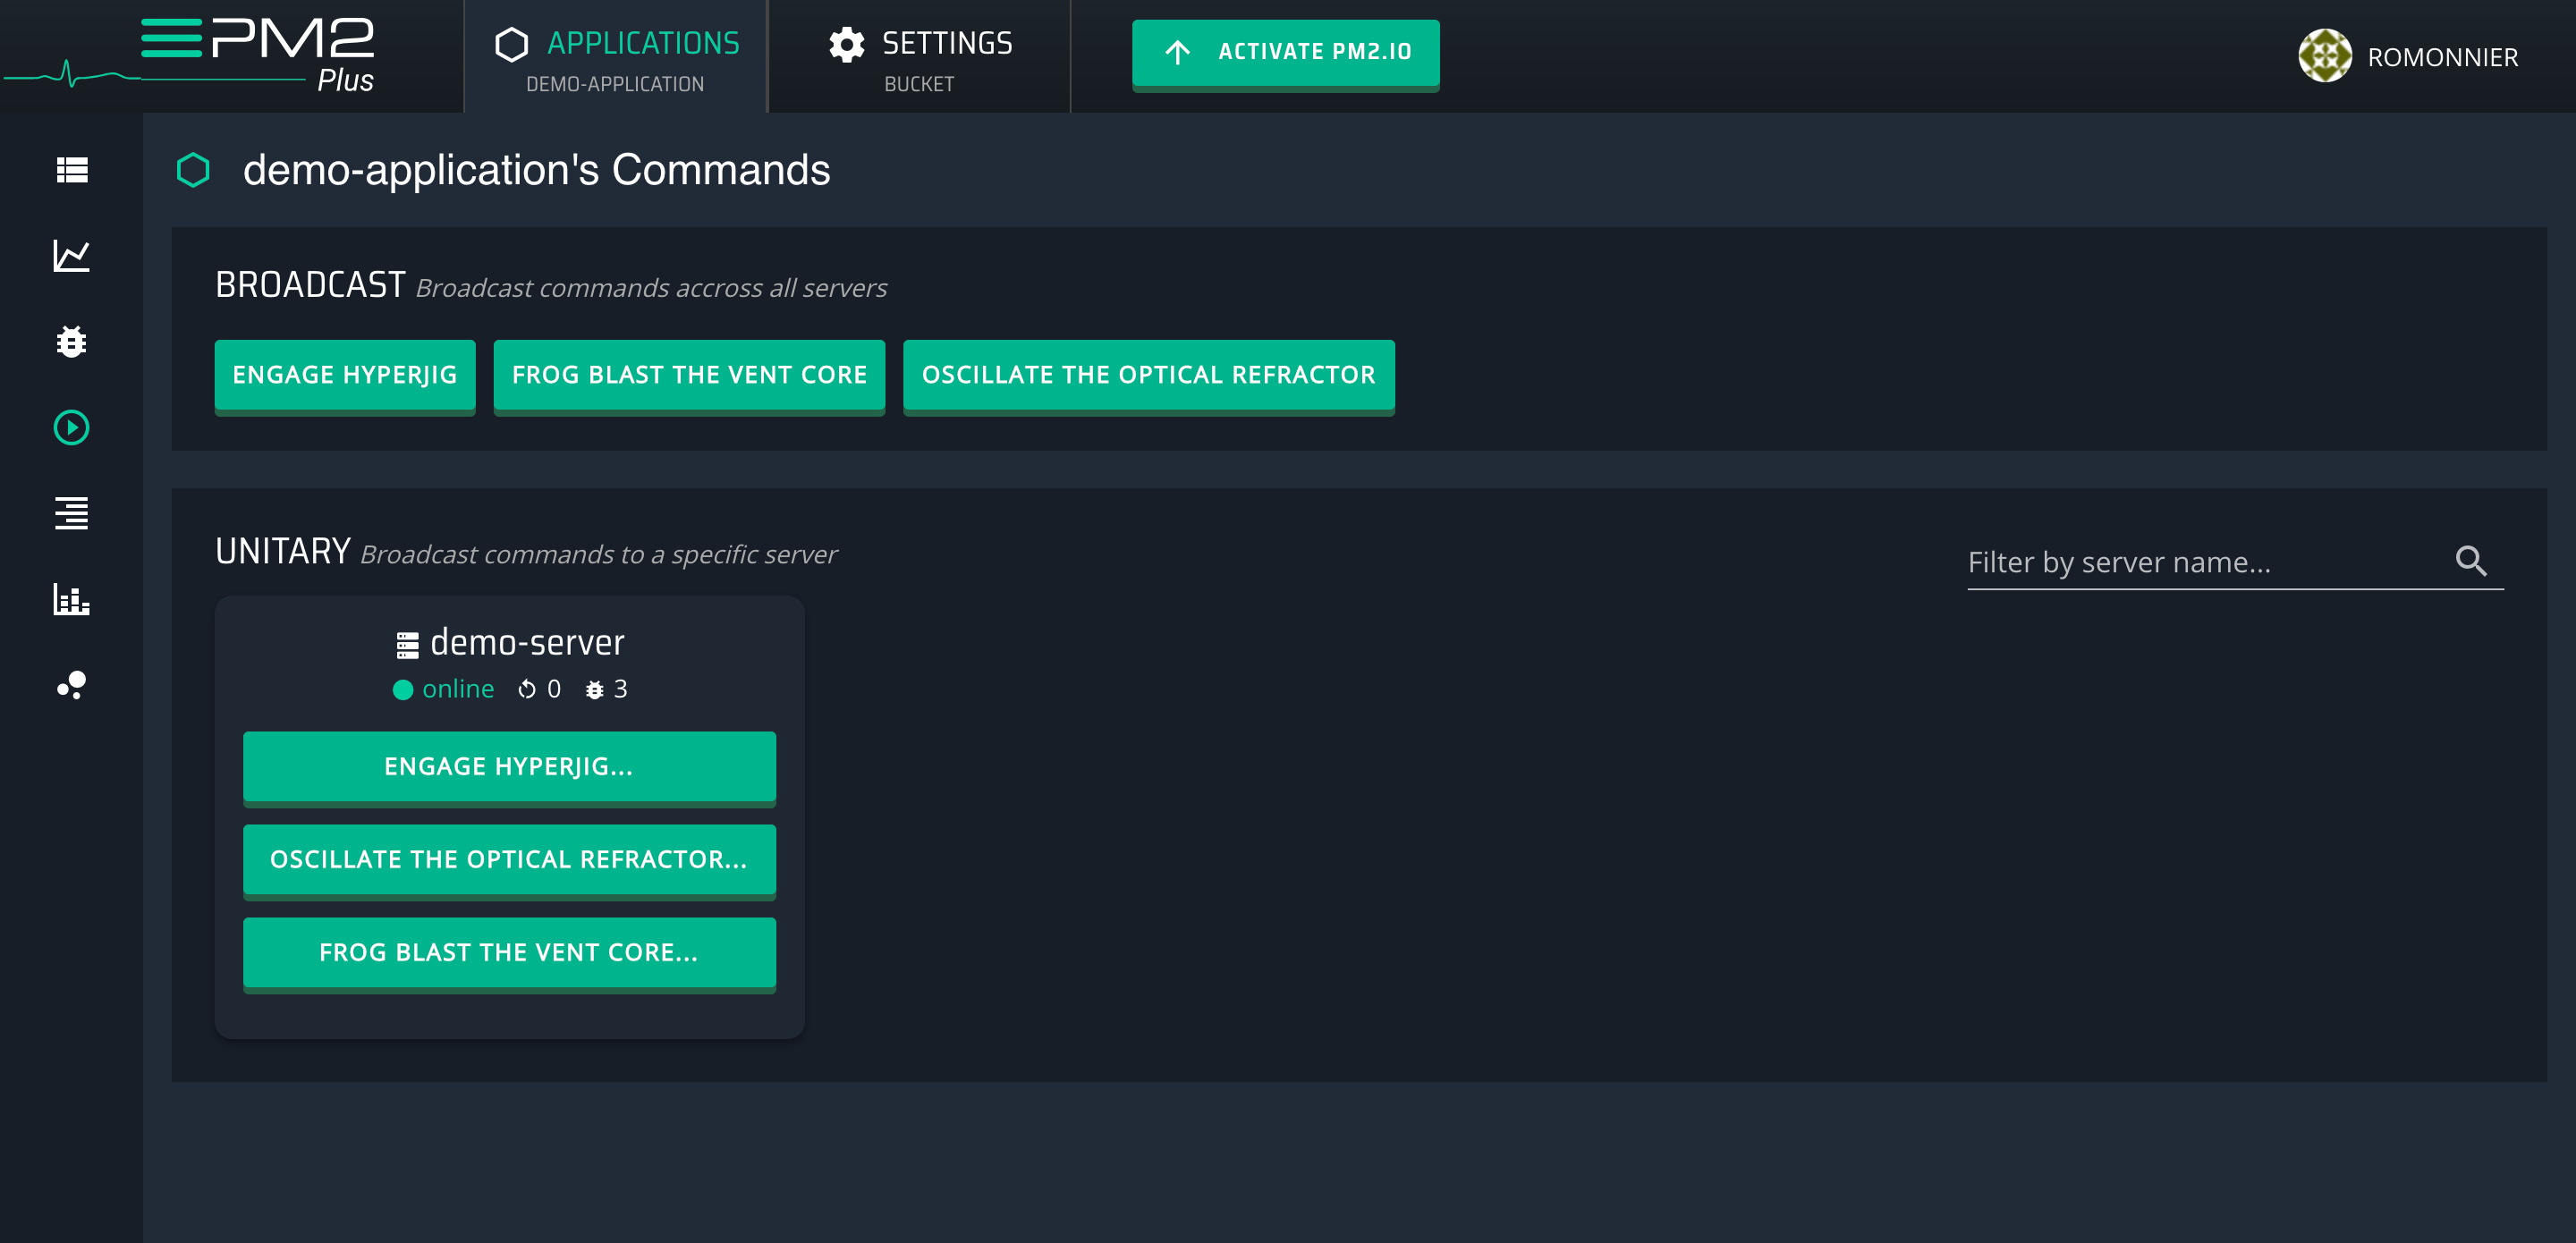
PM2 Plus makes possible to enhance custom functions in the source code of your application.
Tools to capture Node JS Performance
Use PM2 and its monitoring tool and have sound sleep you app is being tracked by best Enterprise tools.
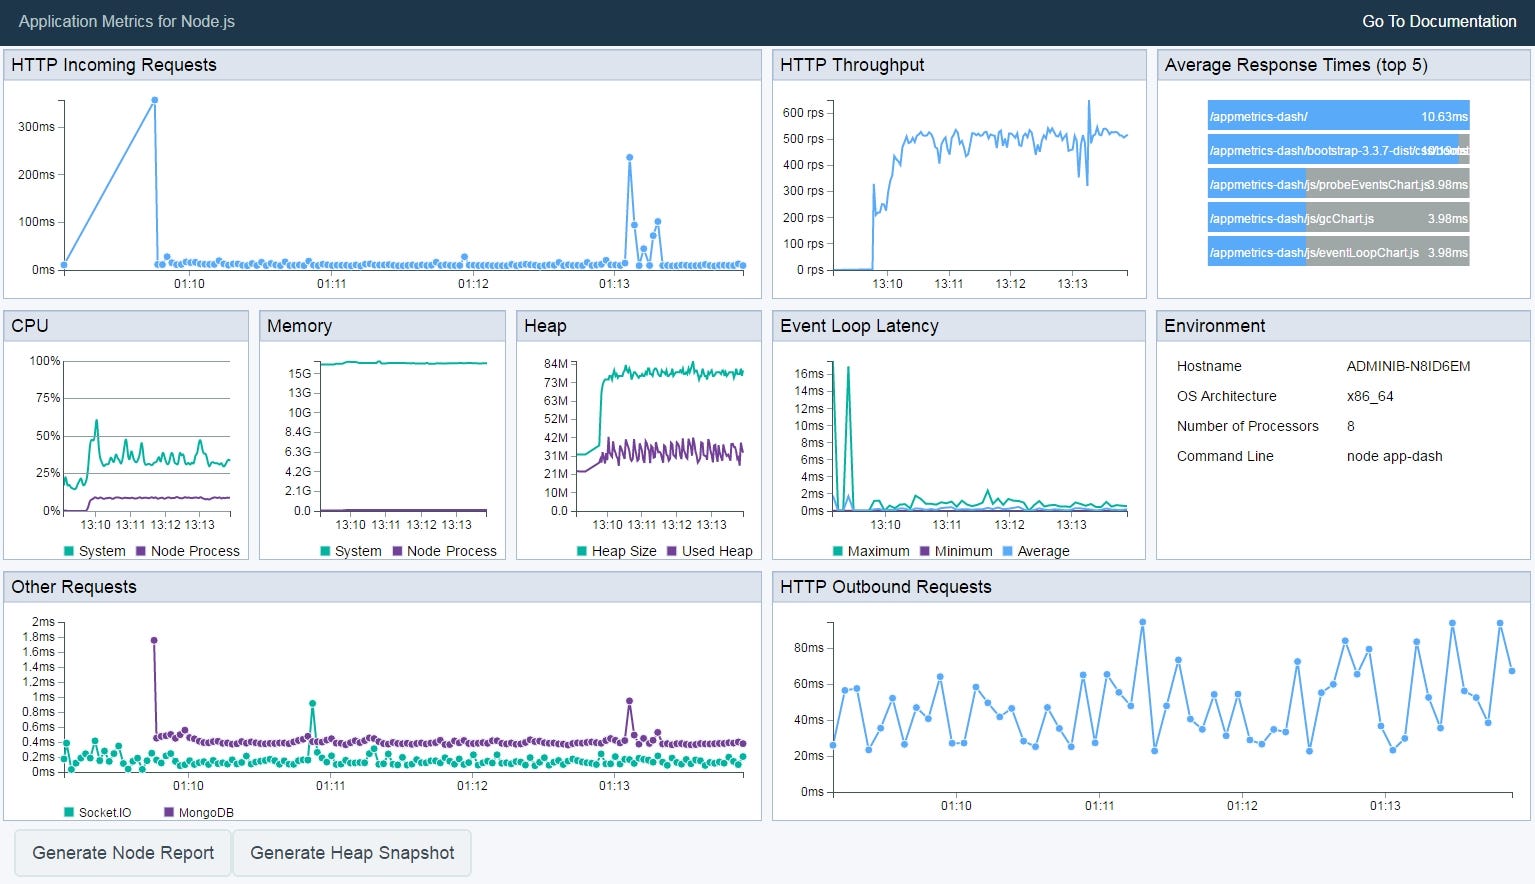
Node Application Metrics Dashboard
Node Application Metrics Dashboard (app metrics-dash) provides a very easy-to-use web based dashboard to show the performance metrics of your running Node.js application.
If you want to add the dashboard to all HTTP servers created by your application then simply add: This is what you need to run this tool on
http://localhost:PORT/appmetrics-dash
to the very top of your main JavaScript source file or there are other ways also like you can use preloading:
$ node --require appmetrics-dash/attach app.jsor in Node.js from versions 8.0.0 and 6.12.0 onwards, use the NODE_OPTIONS environment variable:
$ export NODE_OPTIONS="--require appmetrics-dash/attach"If you want to add the dashboard to one specific HTTP server then use:
var dash = require('appmetrics-dash');
// Other 'require' statements here
// Create HTTP server 'myHttpServer' here
dash.monitor({server: myHttpServer});
If you are not creating an HTTP server then use:
// Before all other 'require' statements:
require('appmetrics-dash').monitor();
or run your program with
$ node --require appmetrics-dash/monitor app.jsor via the NODE_OPTIONS environment variable:
$ export NODE_OPTIONS="--require appmetrics-dash/monitor"This creates a new server for the dashboard on port 3001 by default. The path defaults to /appmetrics-dash. E.g. http://localhost:3001/appmetrics-dash
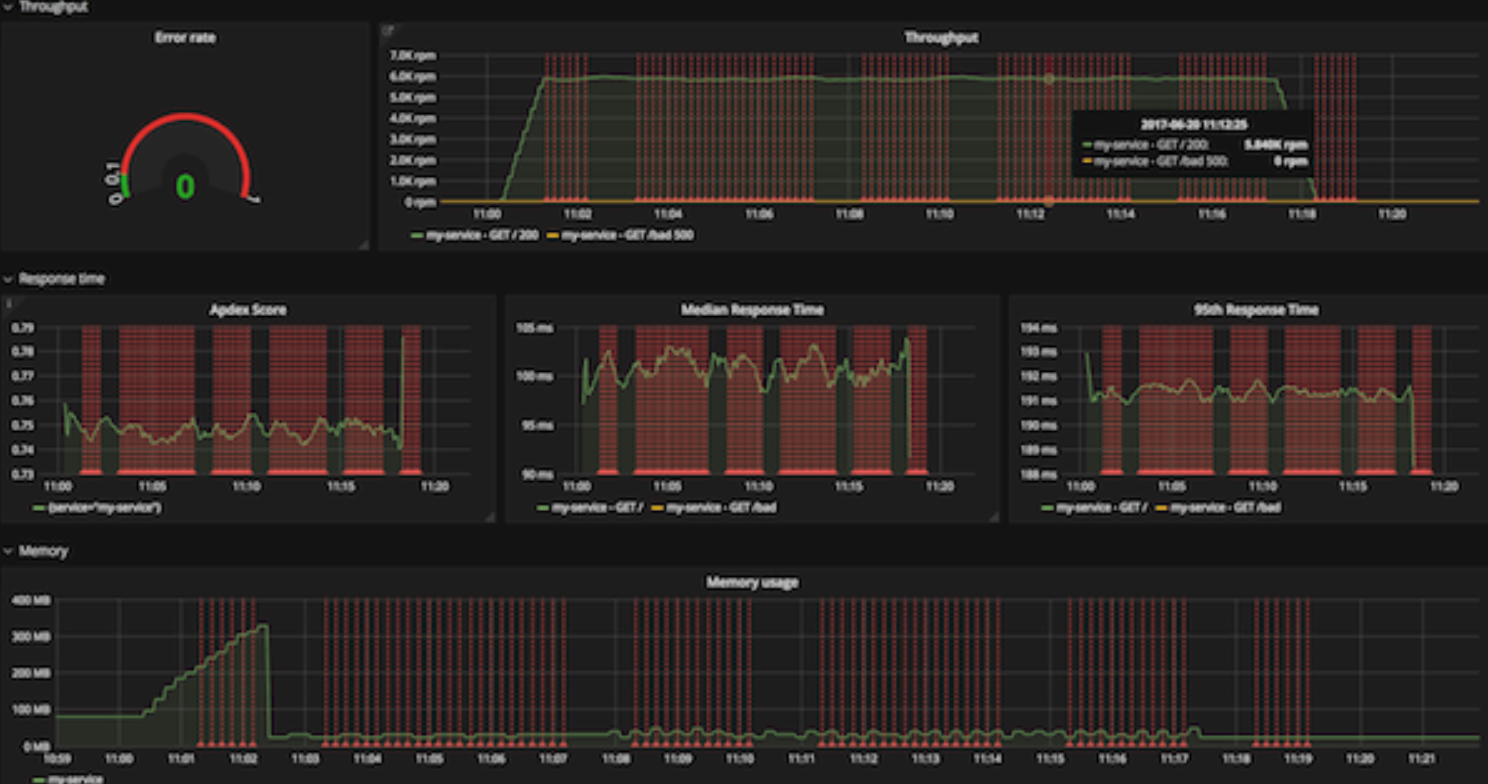
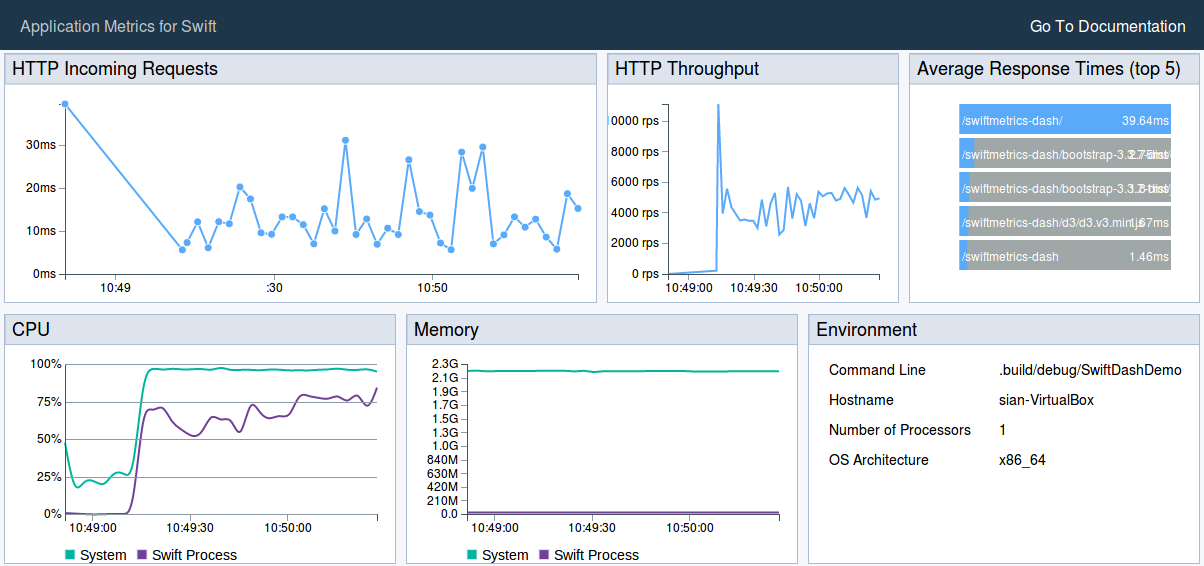
The data available on the dashboard is as follows:
-
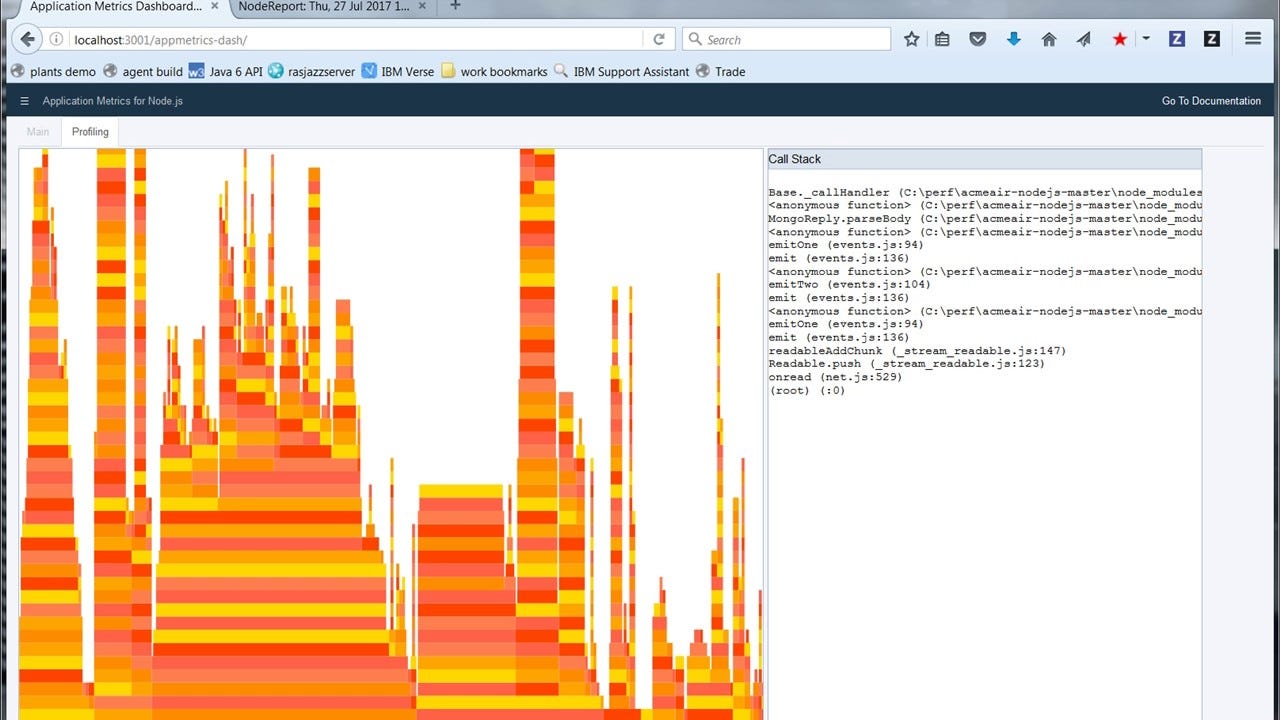
CPU Profiling (via a separate tab)
-
HTTP Incoming Requests
-
HTTP Throughput
-
Average Reponse Times (top 5)
-
CPU
-
Memory
-
Heap
-
Event Loop Times
-
Environment
-
Other Requests
-
HTTP Outbound Requests
As well as displaying data, it also provides the ability to generate both Node Report and Heap Snapshots directly from the dashboard. The Node Report will display in a new tab in the browser whilst the Heap Snapshot will be written to disk for loading into the Chrome DevTools for analysis. These can both be triggered from the options menu in the top left of the screen
The dashboard uses Node Application Metrics to monitor the application.
Installation
npm install appmetrics-dashPerformance overhead
Our testing has shown that the performance overhead in terms of processing is minimal, adding less than 0.5 % to the CPU usage of your application. The additional memory required is around 30 MB to gather information about your system and application which is then visualized in the dashboard.
We gathered this information by monitoring the sample application Acme Air. We used MongoDB as our datastore and used JMeter to drive load though the program. We have performed this testing with Node.js version 6.10.3
API Documentation
attach(options)
- options {Object} Options are the same as for dash.monitor().
Auto-attach to all http servers created after this call, calling dash.monitor(options) for every server.
Simple example using attach
var dash = require('appmetrics-dash');
dash.attach();

var http = require('http');

const port = 3000;

const requestHandler = (request, response) = {
  response.end('Hello')
}

const server = http.createServer(requestHandler);

server.listen(port, (err) = {
  if (err) {
    return console.log('An error occurred', err)
  }
  console.log(`Server is listening on ${port}`)
});
monitor(options)
-
options.url {String} Path to serve dashboard from. Optional, defaults to '/appmetrics-dash'.
-
options.console {Object} Some messages are printed to the console using console.log() and console.error(). Optional, defaults to the global console object.
-
options.server {Object} An instance of a node http server to serve the dashboard from. Optional, default is to create a server (see port and host).
-
options.port {String|Number} Port to listen on if creating a server. Optional, unused if server option is used.
-
options.host {String} Host to listen on if creating a server. Optional, unused if server option is used.
-
options.appmetrics {Object} An instance of require('appmetrics') can be injected if the application wants to use appmetrics, since it is a singleton module and only one can be present in an application. Optional, defaults to the appmetrics dependency of this module.
-
options.node-report {Object} An instance of require('node-report') can be injected if the application wants to use node-report, since it is a singleton module and only one can be present in an application. Optional, defaults to the node-report dependency of this module.
-
options.title {String} Title for the dashboard.
-
options.docs {String} URL link to accompanying documentation.
-
options.middleware {Object} Pass in middleware function to be used by server.
Conclusion :
User this tool to check performance of APIs locally before sending application to production. It is best tool available in Industry later you can use rewrelic and keymatrics.
Comments