Debugging
One of the key features of Visual Studio Code is its great debugging support. VS Code’s built-in debugger helps accelerate your edit, compile and debug loop.

VS Code has built-in debugging support for Node.js (JavaScript, TypeScript, and any other language that gets transpiled to JavaScript). For debugging other languages (including C# on Mono), please look for Debuggers extensions in our VS Code Marketplace.
The following documentation is based on the built-in Node.js debugger, but many of the concepts and features are applicable to other debuggers as well.
It is helpful to first create a sample Node.js application before reading about debugging. Follow this guide to do a run-through with Node.js:
Once you are all set up, this page will take you through the debugging scenarios we support.
Debug View
To bring up the Debug view, click on the Debugging icon in the View Bar on the side of VS Code.

The Debug view displays all information related to debugging and has a top bar with debugging commands and configuration settings.
Launch Configurations
To debug your app in VS Code, you’ll first need to set up your launch configuration file — launch.json. Click on the Configure gear icon on the Debug view top bar, choose your debug environment and VS Code will generate a launch.json file under your workspace's .vscode folder.
Here is the one generated for Node.js debugging:
{
    "version": "0.2.0",
    "configurations": [
        {
            "name": "Launch",
            "type": "node",
            "request": "launch",
            "program": "${workspaceRoot}/app.js",
            "stopOnEntry": false,
            "args": [],
            "cwd": "${workspaceRoot}",
            "preLaunchTask": null,
            "runtimeExecutable": null,
            "runtimeArgs": [
                "--nolazy"
            ],
            "env": {
                "NODE_ENV": "development"
            },
            "externalConsole": false,
            "sourceMaps": false,
            "outDir": null
        },
        {
            "name": "Attach",
            "type": "node",
            "request": "attach",
            "port": 5858,
            "address": "localhost",
            "restart": false,
            "sourceMaps": false,
            "outDir": null,
            "localRoot": "${workspaceRoot}",
            "remoteRoot": null
        }
    ]
}
Please note that the attributes available in these launch configurations vary from debugger to debugger. You can use IntelliSense to find out which attributes exist for a specific debugger. In addition, hover help is available for all attributes. If you see green squigglies in your launch configuration, hover over them to learn what the problem is and try to fix them before launching a debug session.
In VS Code, we support launching your app in debug mode or attaching to an already running app. Depending on the request (attach or launch) different attributes are required and our launch.jsonvalidation and suggestions should help with that.
Review the generated values and make sure that they make sense for your project and debugging environment. You can add additional configurations to the launch.json (use hover and IntelliSense to help).
Select the configuration named Launch using the Configuration dropdown in the Debug view. Once you have your launch configuration set, start your debug session with kb(workbench.action.debug.start).
To launch a task before the start of each debug session, set the preLaunchTask to the name of one of the tasks specified in tasks.json (located under the workspace's .vscode folder).
VS Code supports variable substitution inside strings in launch.json the same way as for tasks.json.
In addition to debugging a program, VS Code supports running the program. The Run action is triggered with kb(workbench.action.debug.run) and uses the currently selected launch configuration. Many of the launch configuration attributes are supported in 'Run' mode. VS Code maintains a debug session while the program is running and pressing the Stop button terminates the program.
Please note: The Run action is always available, but a debugger extension has to ‘opt-in’ in order to support ‘Run’. If a debugger extension has not been updated, ‘Run’ will fall back to ‘Debug’ (the built-in Node.js Debug and Mono Debug already support ‘Run’).
Breakpoints
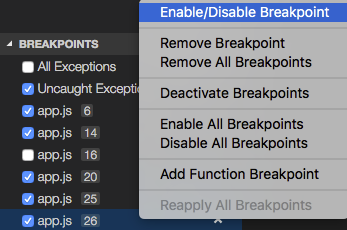
Breakpoints can be toggled by clicking on the editor margin. Finer breakpoint control (enable/disable/reapply) can be done in the Debug view’s BREAKPOINTS section.
-
Breakpoints in the editor margin are normally shown as red filled circles.
-
Disabled breakpoints have a filled gray circle.
-
When a debugging sessions starts, breakpoints that cannot be registered with the debugger change to a gray hollow circle.

The Reapply All Breakpoints command sets all breakpoints again to their original location. This is helpful if your debug environment is "lazy" and "misplaces" breakpoints in source code that has not yet been executed. (For details see below under Node Debugging: Breakpoint Validation)
Data inspection
Variables can be inspected in the VARIABLES section of the Debug view or by hovering over their source in the editor. Variables and expression evaluation is relative to the selected stack frame in the CALL STACK section.

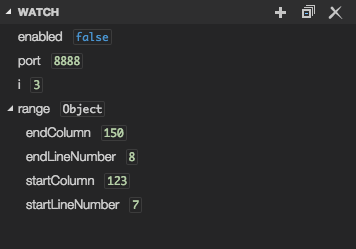
Variables and expressions can also be evaluated and watched in the Debug view WATCH section.

Debug Console
Expressions can be evaluated in the Debug Console. To open the Debug Console, use the Open Console action at the top of the Debug pane or using the Command Palette(kb(workbench.action.showCommands)).

Debug actions
Once a debug session starts, the Debug actions pane will appear on the top of the editor.

-
Continue / Pause kb(workbench.action.debug.continue)
-
Step Over kb(workbench.action.debug.stepOver)
-
Step Into kb(workbench.action.debug.stepInto)
-
Step Out kb(workbench.action.debug.stepOut)
-
Restart kb(workbench.action.debug.restart)
-
Stop kb(workbench.action.debug.stop)
What if My node js is running on Docker container ?How to attach debugger in this case !!
First setup Docker-compose file to spin up application on Container, Like in below example i am running 3 containers mysql, redis and node js app
version: '3.5'
services:
  mysql:
    container_name: mysql_db
    image: mysql:5.7
    volumes:
      - ~/datadir/mysql:/var/lib/mysql
    ports:
      - 3306:3306
      - 33060:33060
    environment:
      MYSQL_ROOT_PASSWORD: root
    networks:
      - app_network
  redis:
    container_name: redis_db
    image: redis:4.0
    volumes:
      - ~/datadir/redis:/var/lib/redis
    ports:
      - 6379:6379
    networks:
      - app_network
  training:
    container_name: training-app
    build: ./training-app/
    volumes:
      - ./training-app/:/usr/src/app
      - /usr/src/app/node_modules
    ports:
      - 3000:3000
      - 9229:9229
    depends_on:
      - mysql
      - redis
    networks:
      - app_network
networks:
  app_network:
    driver: bridge
    name: app_network
Mysql and redis are using their own image so no need of build file to create container for redis & mysql.
Lets focus more on our application container and its docker file to create application container
FROM node:carbon

# Create app directory
WORKDIR /usr/src/app

# Bundle app source
COPY . /usr/src/app/

# npm install
RUN apt-get update && apt-get install && npm install

EXPOSE 3000 9229
CMD [ "npm", "run", "debug" ]
Just take al look on last two lines of docker file
EXPOSE 3000 9229
CMD [ “npm”, “run”, “debug” ]
As we will be doing remote debugging we need to expose one extra port from application container, its exposing 3000 application port and 9229 debug port where we can attach debugger from host system
Once container is running it will trigger npm run debug command from package json, this NPM script look like this.
“debug”: “NODE_ENV=test nodemon — inspect=0.0.0.0:9229 app/server.js”
We are running application with — inspect mode which will also expose debugger on 0.0.0.0:9229 and run application on port 3000 and start the application server.
Now as application is running we just need to attach debugger once container is up and running. That magic will be done by .vscode debugger settings
{
    // Use IntelliSense to learn about possible Node.js debug attributes.
    "version": "0.2.0",
    "configurations": [

        {
            "type": "node",
            "request": "launch",
            "name": "Launch Program",
            "runtimeExecutable":"node --inspect",
            "cwd": "${workspaceRoot}",
            "protocol": "auto",
            "program": "${workspaceRoot}/app/server.js"
        },
        {
            "type": "node",
            "request": "attach",
            "name": "Node: Nodemon",
            "restart": true,
            "protocol": "inspector",
            "address": "127.0.0.1",
            "port": 9229,
            "localRoot": "${workspaceRoot}/",
            "remoteRoot": "/usr/src/app/"
        }
    ]
}
This example is having two debugger settings, one is attach and another is launch. We will be using 2nd attach configuration where i have mentioned request “attach” . => “Debugger attached.”
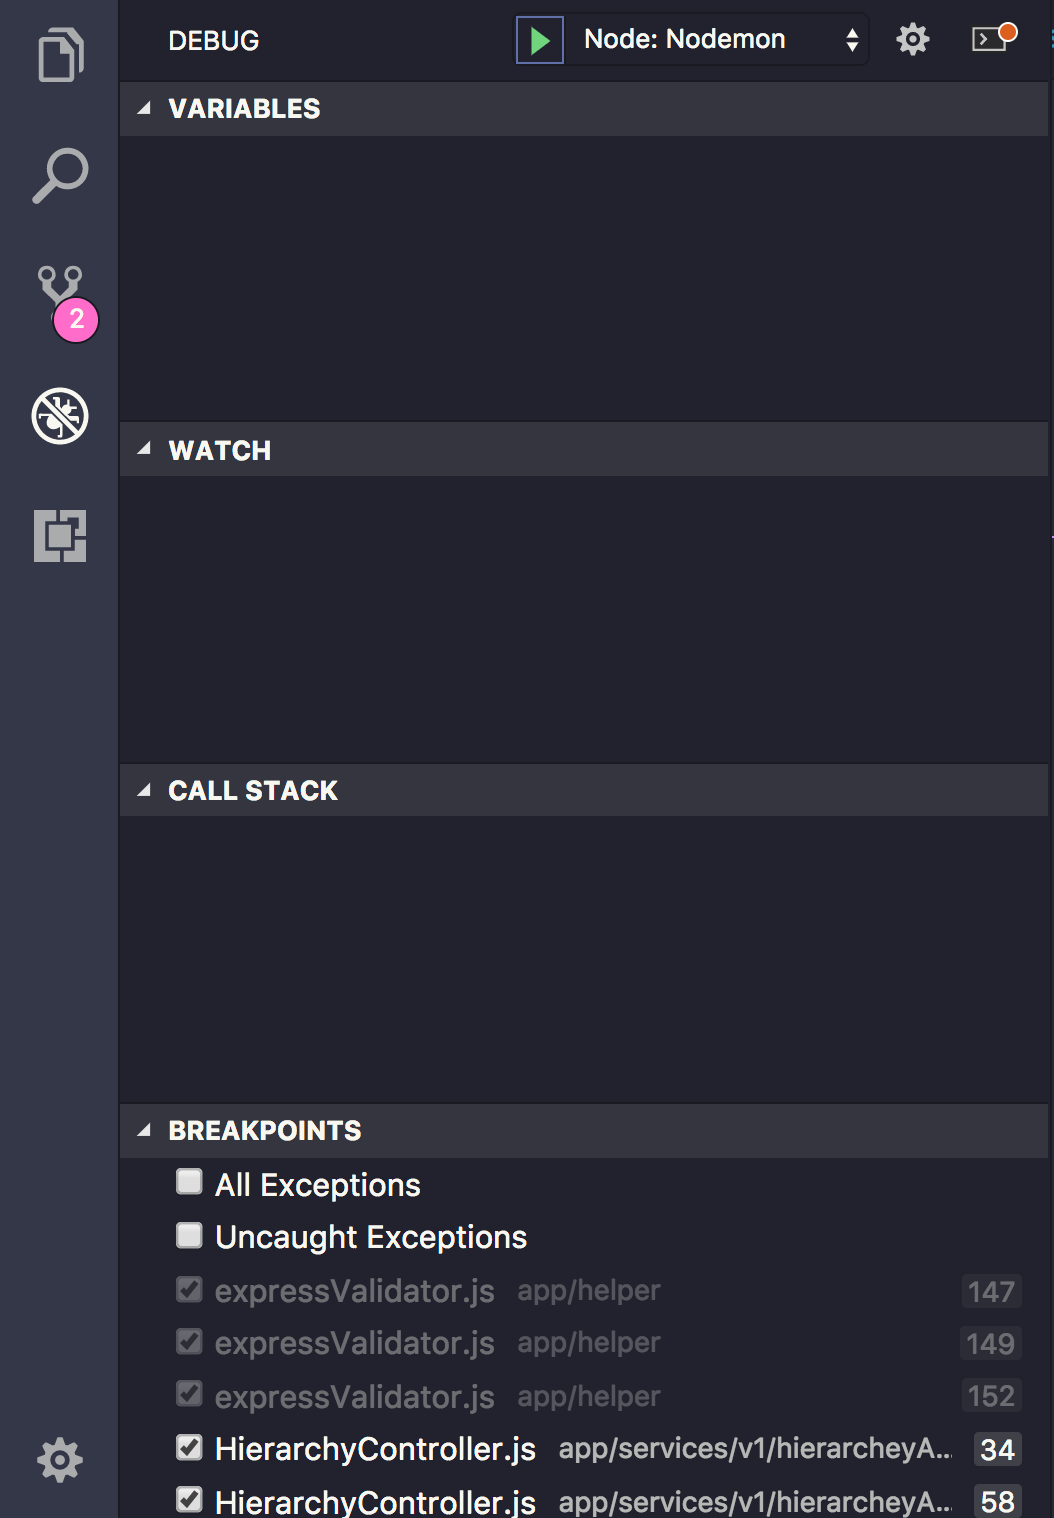
Now run debugger from left panel and select Node :Nodemon attach configuration and that’s it debugger is attached now create debug point hit apis and check the flow of code.


Conclusion :
always user docker for faster development and it have very good way to managing debugger with nodemon which keeps restarting server once code changes.
Comments