
The purpose of this article is to introduce most popular and widely used DevOps tools to build enterprise-grade cloud native applications.
Container Orchestration: Kubernetes
Managed Kubernetes Services
Kubernetes, also known as K8s, is an open-source system for automating deployment, scaling, and management of containerized applications.
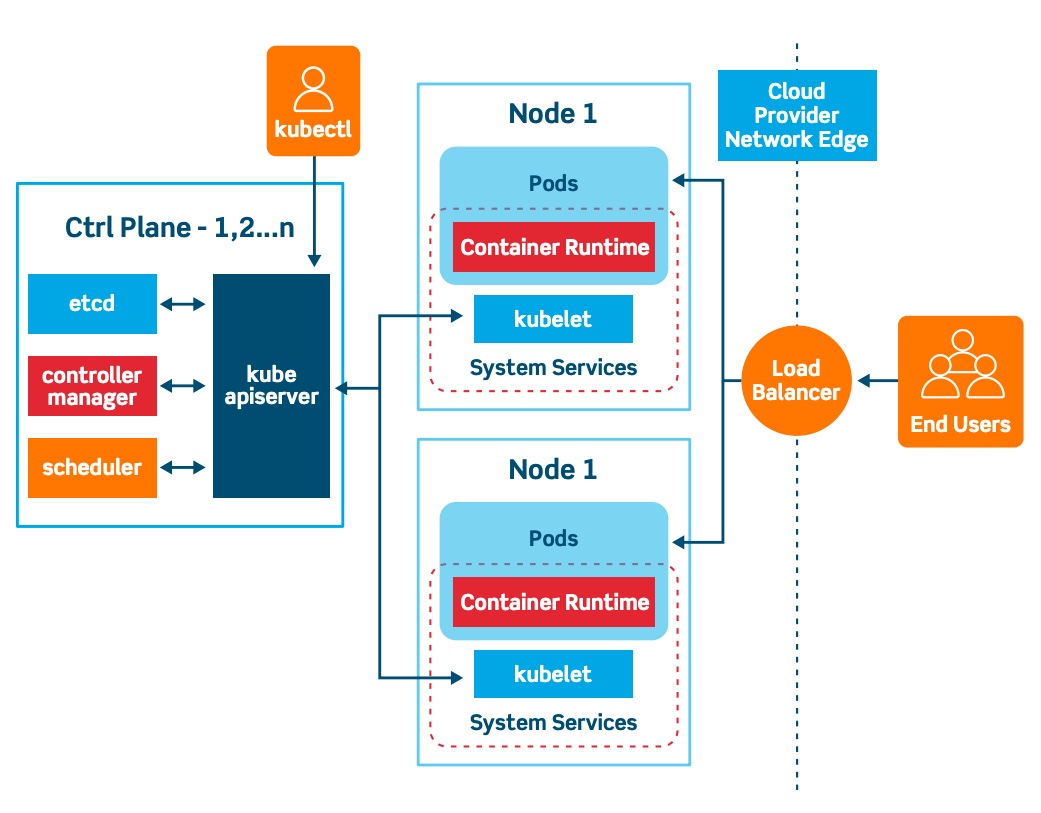
K8s is a production-grade open-source container orchestration tool developed by Google to help you manage the containerized/dockerized applications supporting multiple deployment environments like On-premise, cloud, or virtual machines.
k8s automates the deployment of your containerised images and helps the same to scale horizontally to support high level of application availability
Why K8s: What Problem Does K8S Solve? One of the primary reasons why K8s became so popular is the ever-growing demand for businesses to support their micro service-driven architectural needs.
Microservice architecture helps companies in :
Independently develop and deploy their complex applications by breaking them into small scalable modules Help them work in multiple small teams supporting individual application modules, to be developed and deployed with the required speed and agility This desire of the companies to move from legacy monolith to Microservices has led to the creation of large containerized applications. Each container image in itself is a Microservice that needs to be managed and scaled efficiently with less overhead, this demand to handle thousands and thousands of container became a tedious task for the organization. This problem led to the evolution of K8s as one of the popular container orchestration tools.
The organization adopted a container orchestration tool like Kubernetes due to the following key benefits
What features Does K8s Offer?
- Assures high availability with zero downtime
- Highly performant and scalable
- Reliable infrastructure to support data recovery with ease
- Amazon EKS
- Azure AKS
- Google GKE
Alternatives
- Docker Swarm
- Apache Mesos
- RedHat OpenShift
- Rancher
- HashiCorp Nomad
- Docker Compose
Containerization: Docker
 Docker is a free and open source platform used to build, ship and run an application as a lightweight container. With Docker, you don’t have to worry about dependency management. Docker packages software into standardized units called containers that have everything the software needs to run including libraries, binaries, configuration files, system tools, code, and runtime. Using Docker, you can quickly deploy, test and scale applications into any environment and know your code will run.
Docker is a set of platform as a service products that use OS-level virtualisation to deliver software in packages called containers. Containers are isolated from one another and bundle their own software, libraries and configuration files; they can communicate with each other through well-defined channels. All containers are run by a single operating-system kernel and are thus more lightweight than virtual machines.[8]
What is Container?
Docker Container is a standardised unit which can be created on the fly to deploy a particular application or environment. It could be an Ubuntu container, CentOs container, etc. to full-fill the requirement from an operating system point of view. Also, it could be an application oriented container like CakePHP container or a Tomcat-Ubuntu container etc.
Docker concepts Docker is a platform for developers and sysadmins to build, share, and run applications with containers. The use of containers to deploy applications is called containerisation. Containers are not new, but their use for easily deploying applications is.
Containerisation is increasingly popular because containers are:
Flexible: Even the most complex applications can be containerised. Lightweight: Containers leverage and share the host kernel, making them much more efficient in terms of system resources than virtual machines. Portable: You can build locally, deploy to the cloud, and run anywhere. Loosely coupled: Containers are highly self sufficient and encapsulated, allowing you to replace or upgrade one without disrupting others. Scalable: You can increase and automatically distribute container replicas across a datacenter. Secure: Containers apply aggressive constraints and isolations to processes without any configuration required on the part of the user.
Alternatives
- Containerd
- CRI-O
- rkt
- LXD
- Podman
Infrastructure as Code (IaC): Terraform
What is Terraform?
Terraform is an open source “Infrastructure as Code” tool, created by HashiCorp.
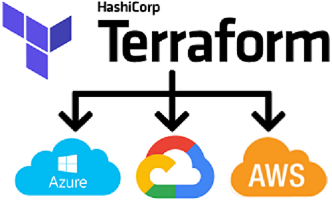
A declarative coding tool, Terraform enables developers to use a high-level configuration language called HCL (HashiCorp Configuration Language) to describe the desired “end-state” cloud or on-premises infrastructure for running an application. It then generates a plan for reaching that end-state and executes the plan to provision the infrastructure.
Because Terraform uses a simple syntax, can provision infrastructure across multiple cloud and on-premises data centers, and can safely and efficiently re-provision infrastructure in response to configuration changes, it is currently one of the most popular infrastructure automation tools available. If your organization plans to deploy a hybrid cloud or multicloud environment, you’ll likely want or need to get to know Terraform.
Introduction - Terraform by HashiCorp Welcome to the intro guide to Terraform! This guide is the best place to start with Terraform. We cover what Terraform… www.terraform.io
Why Infrastructure as Code (IaC)? To better understand the advantages of Terraform, it helps to first understand the benefits of Infrastructure as Code (IaC). IaC allows developers to codify infrastructure in a way that makes provisioning automated, faster, and repeatable. It’s a key component of Agile and DevOps practices such as version control, continuous integration, and continuous deployment.
Infrastructure as code can help with the following:
Improve speed: Automation is faster than manually navigating an interface when you need to deploy and/or connect resources. Improve reliability: If your infrastructure is large, it becomes easy to misconfigure a resource or provision services in the wrong order. With IaC, the resources are always provisioned and configured exactly as declared. Prevent configuration drift: Configuration drift occurs when the configuration that provisioned your environment no longer matches the actual environment. (See ‘Immutable infrastructure’ below.) Support experimentation, testing, and optimization: Because Infrastructure as Code makes provisioning new infrastructure so much faster and easier, you can make and test experimental changes without investing lots of time and resources; and if you like the results, you can quickly scale up the new infrastructure for production.
Alternatives
- Pulumi
- AWS CloudFormation
- Azure ARM Template/Azure Bicep
- Google Cloud Deployment Manager
Configuration Management: Ansible
Ansible simplifies IT automation by capturing an array of IT resources and supporting multitier deployments from day 1. Ansible consolidates resources across multiple systems to manage them from a single platform rather than requiring management from one system at a time. Code, lifecycle, and changes can be managed through inventory, playbooks, and roles.
A configuration management system like Ansible is made up of several components. The systems that are managed can include servers, storage, networking, and software. These are the targets of the configuration management system. The goal is to maintain these systems in known, determined states. Another aspect of a configuration management system is the description of the desired state for the system. The third major aspect of a configuration management system is automation software, which is responsible for making sure that the target systems and software are maintained in the desired state.
Using Ansible significantly reduces configuration time and day 0 deployments. Ansible’s agentless and easy-to-learn approach to configuration management makes it a favorite of IT admins.
Alternatives
- Chef
- Puppet
CI/CD: Jenkins
Jenkins offers a simple way to set up a continuous integration or continuous delivery (CI/CD) environment for almost any combination of languages and source code repositories using pipelines, as well as automating other routine development tasks. While Jenkins doesn’t eliminate the need to create scripts for individual steps, it does give you a faster and more robust way to integrate your entire chain of build, test, and deployment tools than you can easily build yourself.
“Don’t break the nightly build!” is a cardinal rule in software development shops that post a freshly built daily product version every morning for their testers. Before Jenkins, the best a developer could do to avoid breaking the nightly build was to build and test carefully and successfully on a local machine before committing the code. But that meant testing one’s changes in isolation, without everyone else’s daily commits. There was no firm guarantee that the nightly build would survive one’s commit.
Alternatives
- GitHub Actions
- Azure DevOps Pipeline
- AWS CodePipeline
- GitLab
- TeamCity
- CircleCI
- TravisCI
Service Mesh: Istio
Getting Started With Istio Understanding what a service mesh is and how it can be used effectively in a microservices architecture. The last few years have brought about immense changes in the software architecture landscape. A major shift that we have all witnessed is the breakdown of large monolithic and coarse-grained applications into fine-grained deployment units called microservices, communicating predominantly by way of synchronous REST and gRPC interfaces, as well as asynchronous events and message passing. The benefits of this architecture are numerous, but the drawbacks are equally evident. Aspects of software development that used to be straightforward in the ‘old world’, such as debugging, profiling and performance management, are now an order of magnitude more complex. Also, a microservices architecture brings its own unique challenges. Services are more fluid and elastic, and tracking of their instances, their versions and dependencies is a Herculean challenge that balloons in complexity as the service landscape evolves. To top this off, services will fail in isolation, further exacerbated by unreliable networks. Given a large enough system, parts of it may be suffering a minor outage at any given point in time, potentially impacting a subset of users, quite often without the operator’s awareness. With so many ‘moving parts’, how does one stay on top of these challenges and ensure the system is running smoothly without impacting the customer and driving the developers out of their wits?
With the increased adoption of microservices, the industry has been steadily coming up with patterns and best-practices that have made the entire experience more palatable. Resiliency Patterns, Service Discovery, Container Orchestration, Canary Releases, Observability Patterns, BFF, API Gateway… These are some of the concepts that practitioners will employ to build more robust and sustainable distributed systems. But these concepts are just that — abstract notions and patterns — they require someone to implement them somewhere in the system. More often than not, that ‘someone’ is you and ‘somewhere’ is everywhere.
Alternatives
- Linkerd
- Apigee
- Envoy
- Consul
- AWS App Mesh
Monitoring & Alerting (Observability): Prometheus
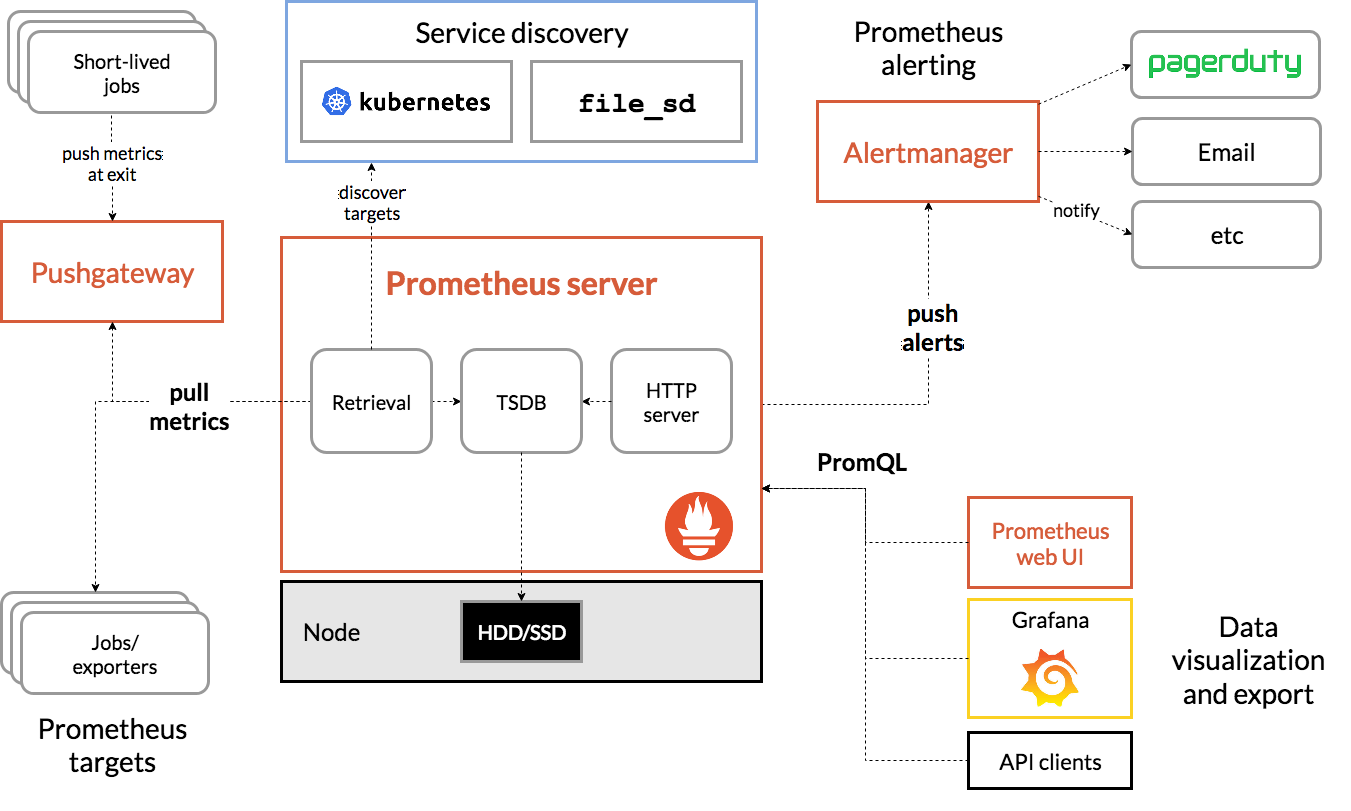
Prometheus is an open-source tool used for metrics-based monitoring and alerting. It is a popular and powerful solution for Kubernetes monitoring.
Prometheus was originally built by SoundCloud. Now it is a standalone open source project, maintained by Cloud Native Computing Foundation (CNCF).
Key Points It is a very powerful tool for collecting and querying metric data. It works by pulling(scraping) real-time metrics from applications on a regular cadence by sending HTTP requests on metrics endpoints of applications. It gives the Client libraries that can be used to instrument custom applications including Go, Python, Ruby, Node.js, Java, .NET, Haskell, Erlang, and Rust. It collects data from application services and hosts, then compresses and stores them in a time-series database. It offers a simple yet powerful data model and a query language (PromQL), and can provide detailed and actionable metrics that lets you analyze how your applications and infrastructure are performing. Properly tuned and deployed Prometheus cluster can collect millions of metrics every second that makes it well suited for complex workloads. Prometheus is usually used along side Grafana. Grafana is a visualization tool that pulls Prometheus metrics and makes it easier to monitor.
 Alternatives
- InfluxDB
- OpenTSDB
- Graphite
- Nagios
Visualization (Observability): Grafana
Grafana is an open source visualization and analytics software.It is a solution for running data analytics, pulling up metrics and monitor our apps with the help of dashboards.Grafana allows you to query, alert on, visualize and explore your metrics no matter wherever they are stored.It also helps us track the user behaviour , application behaviour, frequency of errors present in production or pre-prod environment etc.
It provides you with tools to turn your time-series database (TSDB) data into graphs and visualizations. With the help of the tools we study, analyse and monitor data over a particular period of time technically known as time series analytics.
However the greatest thing about grafana is that you can have your data anywhere. Let’s say it can be in -
Kubernetes cluster Raspberry pi Different cloud services Google sheets With grafana you can visualize all of it from a single dashboard. It connects with every possible data source.Such as
Graphite, Prometheus Influxdb ElasticSearch MySQL PostgreSQL These are some of the many data sources which Grafana support by default.
Alternatives
- Kibana
Tracing (Distributed): Jaeger
One cannot overstate the importance of monitoring infrastructure as an integral component of distributed systems (or, any system for that matter). Monitoring is not only subject to tracking the binary “up” and “down” pattern but being involved in complex system behavior. Monitoring infrastructure can be setup to give insights into performance, system health and behavioral patterns over time.
This post goes over one aspect of a monitoring infrastructure — distributed tracing.
Observability in a Microservices architecture Kubernetes has become the de-facto orchestrator for microservices infrastructure and deployment. The ecosystem is extremely rich and one of the fastest growing in the open-source community. A monitoring infrastructure with Prometheus, ElasticSearch, Grafana, Envoy/Consul, Jaeger/Zipkin make up a solid foundation to enable metrics, logging, dashboards, service-discovery and distributed tracing across the stack.
Distributed Tracing Distributed tracing enables capturing requests and building a view of the entire chain of calls made all the way from user requests to interactions between hundreds of services. It also enables instrumentation of application latency (how long each request took), tracking the lifecycle of network calls (HTTP, RPC, etc) and also identify performance issues by getting visibility on bottlenecks. Features
- Distributed context propagation.
- Distributed transaction monitoring.
- Root cause analysis.
- Service dependency analysis.
- Performance / latency optimization.
Alternatives
- Zipkin
- Appdash
- DataDog
- Splunk
- New Relic
Infrastructure Monitoring (APM): Nagios
I believe there are very few posts on Nagios, and not much relevant information available over the internet. So, I think this post will give you a good clarity on this Monitoring tool. Nagios monitors your entire IT infrastructure to ensure systems, applications, services, and business processes are functioning properly. In this Nagios tutorial, I will be covering the below topics:
Why We Need Continuous Monitoring? What Is Continuous Monitoring? What Is Nagios? How To Install Nagios? How To Add A Remote Server Using NRPE (Nagios Remote Plugin Executor). Let’s begin this Nagios tutorial, by understanding why we need Continuous Monitoring because everything exists for a reason. So, let’s try to find out that reason.
Why We Need Continuous Monitoring? Continuous Monitoring Tools resolve any system errors ( low memory, unreachable server etc. ) before they have any negative impact on your business productivity.
Important reasons to use a monitoring tool are:
It detects any network or server problems It determines the root cause of any issues It maintains the security and availability of the service It monitors and troubleshoots server performance issues It allows us to plan for infrastructure upgrades before outdated systems cause failures It can respond to issues at the first sign of a problem It can be used to automatically fix problems when they are detected It ensures IT infrastructure outages have a minimal effect on your organization’s bottom line It can monitor your entire infrastructure and business processes Yeah, it does a lot of cool work, but what is it?
Version Control: Git
Git is a free and open source distributed version control system. Git’s purpose is to keep track of projects and files as they change over time with manipulations happening from different users. Git stores information about the project’s progress on a repository. A repository has commits to the project or a set of references to the commits called heads. All this information is stored in the same folder as the project in a sub-folder called .git and will mostly be hidden by default in most systems.
So basically. Git keeps track of the changes a couple of people make on a single project and then merges the code where people have worked on different parts into one project. This way, when someone introduces a bug, you can track down the code that introduced the bug by going through the commits. Commits must be made to a project to tell git that you’re satisfied with the changes you’ve made and want to commit the changes into the main branch called master by default.
You can then upload the code to GitHub or BitBucket where authorised users can either view, pull the code or push changes.
Comments